Australian Centre for Precision Health, Unit of Clinical and Health Sciences, University of South Australia, Adelaide, Australia.
South Australian Health and Medical Research Institute, Adelaide, Australia.
Diabetes Obes Metab. 2023 Jan;25(1):121-131. doi: 10.1111/dom.14853. Epub 2022 Sep 21.
To evaluate associations of metabolic profiles and biomarkers with brain atrophy, lesions, and iron deposition to understand the early risk factors associated with dementia.
Using data from 26 239 UK Biobank participants free from dementia and stroke, we assessed the associations of metabolic subgroups, derived using an artificial neural network approach (self-organizing map), and 39 individual biomarkers with brain MRI measures: total brain volume (TBV), grey matter volume (GMV), white matter volume (WMV), hippocampal volume (HV), white matter hyperintensity (WMH) volume, and caudate iron deposition.
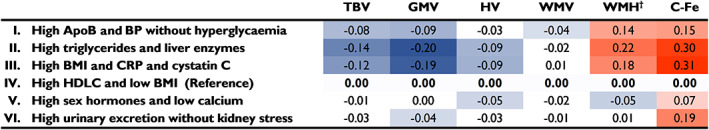
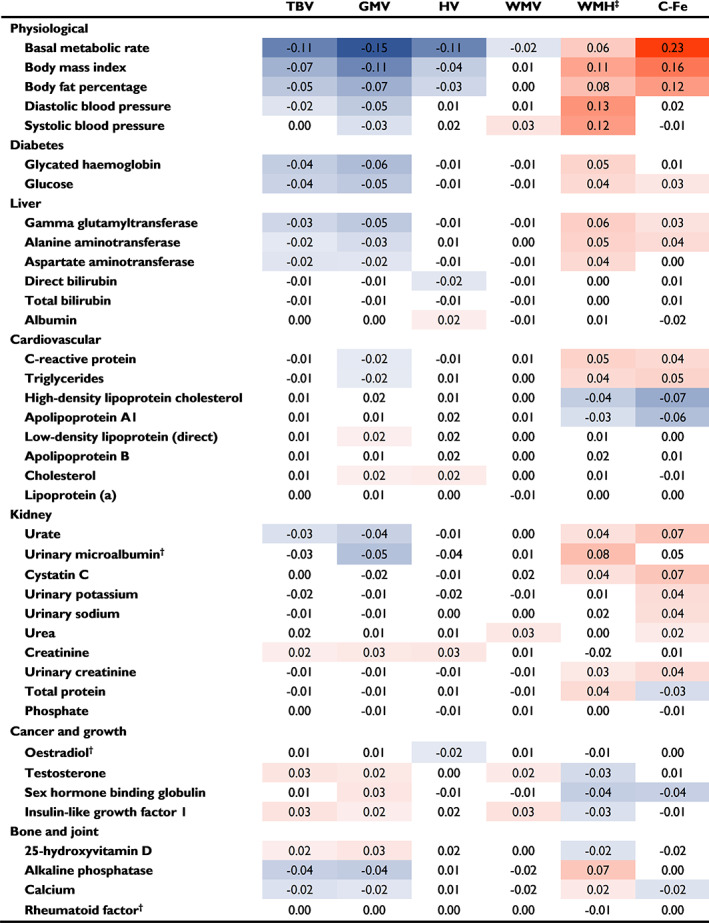
In metabolic subgroup analyses, participants characterized by high triglycerides and liver enzymes showed the most adverse brain outcomes compared to the healthy reference subgroup with high-density lipoprotein cholesterol and low body mass index (BMI) including associations with GMV (β -0.20, 95% confidence interval [CI] -0.24 to -0.16), HV (β -0.09, 95% CI -0.13 to -0.04), WMH volume (β 0.22, 95% CI 0.18 to 0.26), and caudate iron deposition (β 0.30, 95% CI 0.25 to 0.34), with similar adverse associations for the subgroup with high BMI, C-reactive protein and cystatin C, and the subgroup with high blood pressure (BP) and apolipoprotein B. Among the biomarkers, striking associations were seen between basal metabolic rate (BMR) and caudate iron deposition (β 0.23, 95% CI 0.22 to 0.24 per 1 SD increase), GMV (β -0.15, 95% CI -0.16 to -0.14) and HV (β -0.11, 95% CI -0.12 to -0.10), and between BP and WMH volume (β 0.13, 95% CI 0.12 to 0.14 for diastolic BP).
Metabolic profiles were associated differentially with brain neuroimaging characteristics. Associations of BMR, BP and other individual biomarkers may provide insights into actionable mechanisms driving these brain associations.
评估代谢特征和生物标志物与脑萎缩、病变和铁沉积的关联,以了解与痴呆相关的早期风险因素。
利用来自 26239 名无痴呆和中风的英国生物库参与者的数据,我们评估了代谢亚组(使用人工神经网络方法(自组织映射)得出)和 39 种个体生物标志物与脑 MRI 测量值之间的关联:总脑容量(TBV)、灰质体积(GMV)、白质体积(WMV)、海马体积(HV)、脑白质高信号(WMH)体积和尾状核铁沉积。
在代谢亚组分析中,与高密度脂蛋白胆固醇和低体重指数(BMI)的健康参考亚组相比,表现出高甘油三酯和肝酶的参与者的脑结局最差,包括与 GMV(β-0.20,95%置信区间[CI] -0.24 至 -0.16)、HV(β-0.09,95%CI -0.13 至 -0.04)、WMH 体积(β 0.22,95%CI 0.18 至 0.26)和尾状核铁沉积(β 0.30,95%CI 0.25 至 0.34)的关联,具有相似的不利关联对于 BMI、C 反应蛋白和胱抑素 C 较高的亚组以及血压(BP)和载脂蛋白 B 较高的亚组。在生物标志物中,基础代谢率(BMR)与尾状核铁沉积(β 0.23,95%CI 0.22 至 0.24 每 1SD 增加)、GMV(β-0.15,95%CI -0.16 至 -0.14)和 HV(β-0.11,95%CI -0.12 至 -0.10)之间存在显著关联,BP 与 WMH 体积(β 0.13,95%CI 舒张压为 0.12 至 0.14)之间存在关联。
代谢特征与脑影像学特征存在差异关联。BMR、BP 和其他个体生物标志物的关联可能为驱动这些脑关联的可操作机制提供见解。