BSICoS Group, Aragón Institute of Engineering Research (I3A), University of Zaragoza, Zaragoza, Spain.
CoMBA & BSICoS Groups, Facultad de Ciencias de la Salud, Universidad San Jorge, Zaragoza, Spain.
Med Biol Eng Comput. 2022 Nov;60(11):3091-3112. doi: 10.1007/s11517-022-02648-3. Epub 2022 Sep 13.
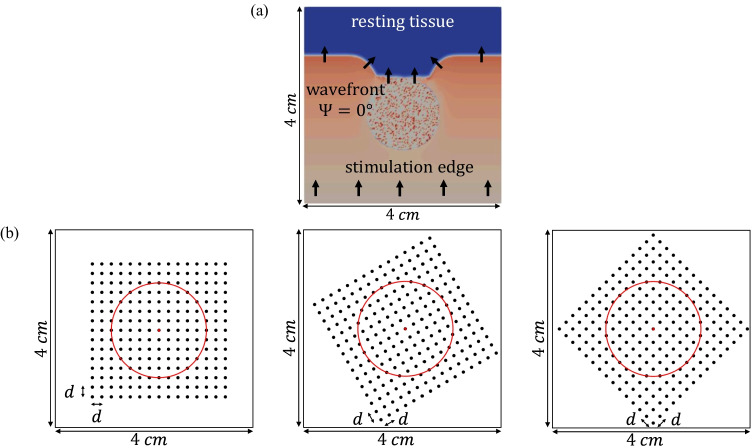
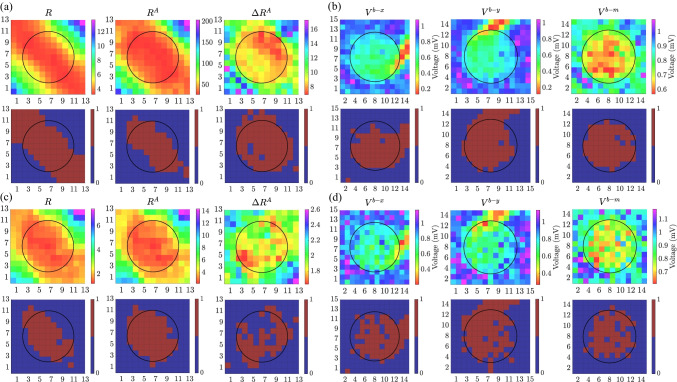
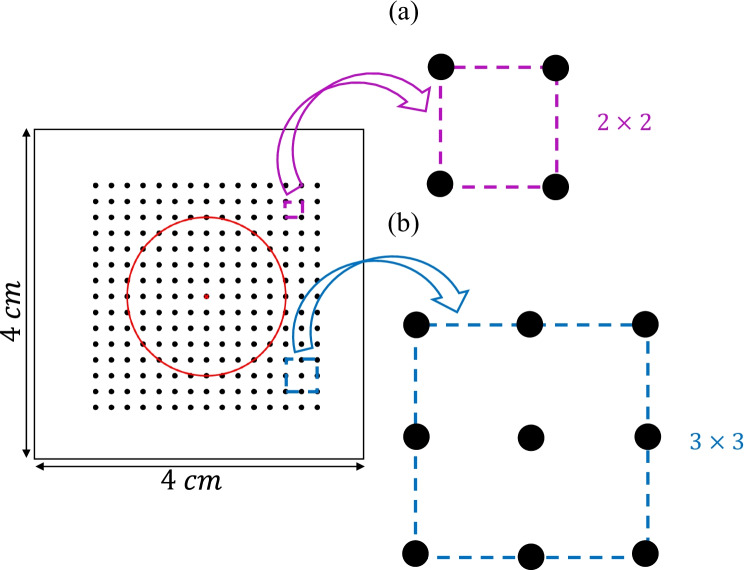
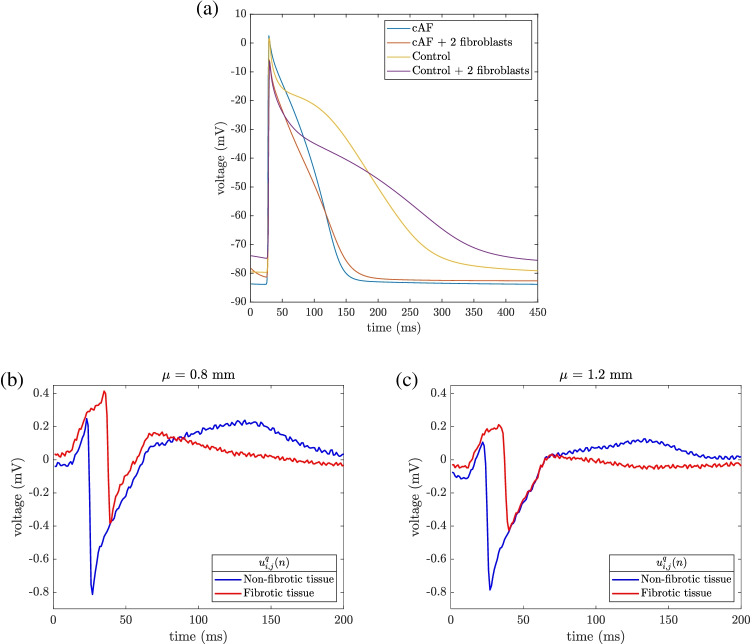
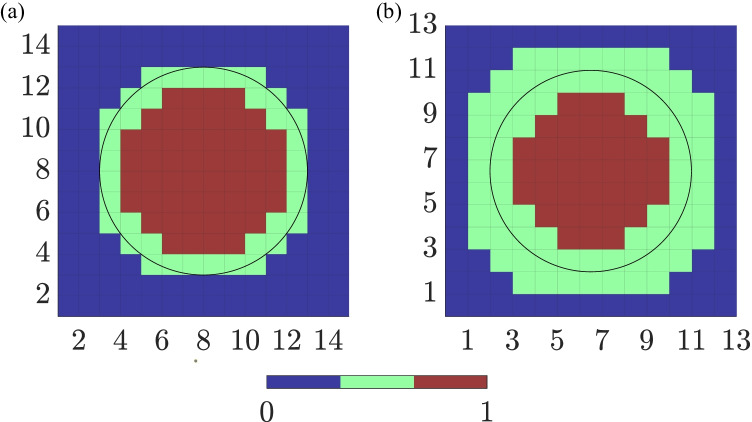
Atrial fibrosis plays a key role in the initiation and progression of atrial fibrillation (AF). Atrial fibrosis is typically identified by a peak-to-peak amplitude of bipolar electrograms (b-EGMs) lower than 0.5 mV, which may be considered as ablation targets. Nevertheless, this approach disregards signal spatiotemporal information and b-EGM sensitivity to catheter orientation. To overcome these limitations, we propose the dominant-to-remaining eigenvalue dominance ratio (EIGDR) of unipolar electrograms (u-EGMs) within neighbor electrode cliques as a waveform dispersion measure, hypothesizing that it is correlated with the presence of fibrosis. A simulated 2D tissue with a fibrosis patch was used for validation. We computed EIGDR maps from both original and time-aligned u-EGMs, denoted as [Formula: see text] and [Formula: see text], respectively, also mapping the gain in eigenvalue concentration obtained by the alignment, [Formula: see text]. The performance of each map in detecting fibrosis was evaluated in scenarios including noise and variable electrode-tissue distance. Best results were achieved by [Formula: see text], reaching 94% detection accuracy, versus the 86% of b-EGMs voltage maps. The proposed strategy was also tested in real u-EGMs from fibrotic and non-fibrotic areas over 3D electroanatomical maps, supporting the ability of the EIGDRs as fibrosis markers, encouraging further studies to confirm their translation to clinical settings. Upper panels: map of [Formula: see text] from 3×3 cliques for Ψ= 0 and bipolar voltage map V, performed assuming a variable electrode-to-tissue distance and noisy u-EGMs (noise level σ = 46.4 μV ). Lower panels: detected fibrotic areas (brown), using the thresholds that maximize detection accuracy of each map.
心房纤维化在心房颤动 (AF) 的发生和发展中起关键作用。通常通过双极电图 (b-EGM) 的峰峰值幅度低于 0.5 mV 来识别心房纤维化,这可能被认为是消融靶点。然而,这种方法忽略了信号时空信息和 b-EGM 对导管方向的敏感性。为了克服这些限制,我们提出了单极电图 (u-EGM) 中邻电极群内的主导到剩余特征值优势比 (EIGDR) 作为波形分散度的度量,假设它与纤维化的存在相关。使用具有纤维化斑块的模拟 2D 组织进行了验证。我们从原始和时间对齐的 u-EGM 计算了 EIGDR 图,分别表示为 [Formula: see text] 和 [Formula: see text],还映射了通过对齐获得的特征值集中的增益 [Formula: see text]。在包括噪声和可变电极-组织距离的场景中评估了每种图谱检测纤维化的性能。通过 [Formula: see text] 获得了最佳结果,检测准确率达到 94%,而 b-EGM 电压图谱的准确率为 86%。还在 3D 电解剖图谱上的纤维化和非纤维化区域的真实 u-EGM 上测试了该策略,支持 EIGDR 作为纤维化标志物的能力,鼓励进一步研究以确认其在临床环境中的转化。上排图:在 Ψ=0 和双极电压图 V 下,对 3×3 簇的 [Formula: see text] 进行了映射,假设电极-组织距离和噪声 u-EGM(噪声水平 σ=46.4 μV)可变。下排图:使用每种图谱的检测准确率最大的阈值,检测到的纤维化区域(棕色)。