Zhao Tianxin, Wang Zelin
Department of Pediatric Urology, Guangzhou Women and Children's Medical Center, Guangzhou Medical University, Guangdong Provincial Clinical Research Center for Child Health, Guangzhou, Guangdong, China.
Department of Bioinformatics, Shuzhi Biotech, LLC, Guangzhou, Guangdong, China.
Front Genet. 2022 Sep 7;13:957317. doi: 10.3389/fgene.2022.957317. eCollection 2022.
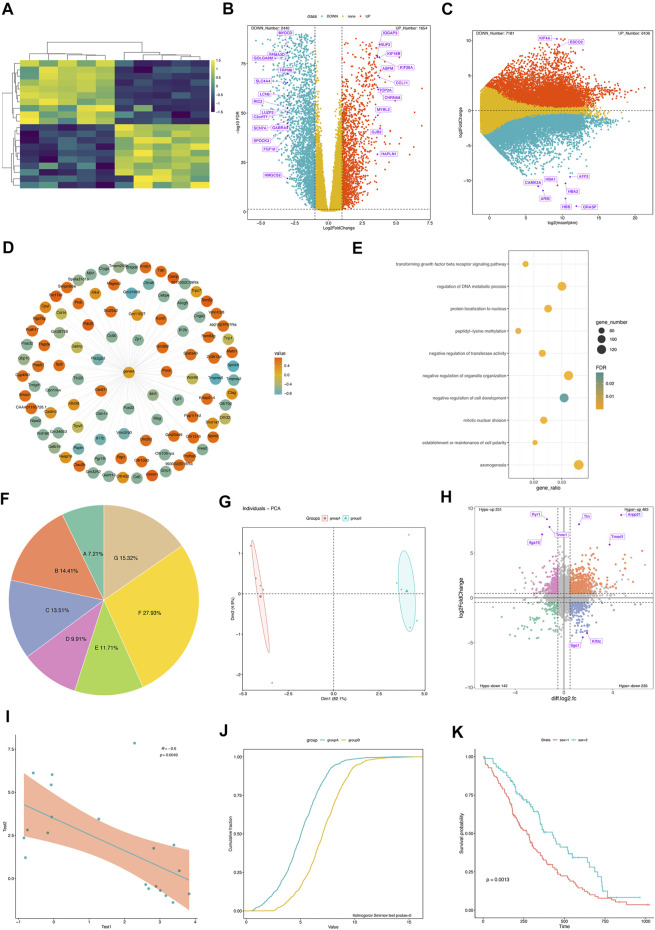
Massive amounts of omics data are produced and usually require sophisticated visualization analysis. These analyses often require programming skills, which are difficult for experimental biologists. Thus, more user-friendly tools are urgently needed. Herein, we present GraphBio, a shiny web app to easily perform visualization analysis for omics data. GraphBio provides 15 popular visualization analysis methods, including heatmap, volcano plots, MA plots, network plots, dot plots, chord plots, pie plots, four quadrant diagrams, Venn diagrams, cumulative distribution curves, principal component analysis (PCA), survival analysis, receiver operating characteristic (ROC) analysis, correlation analysis, and text cluster analysis. It enables experimental biologists without programming skills to easily perform popular visualization analysis and get publication-ready figures. GraphBio, as an online web application, is freely available at http://www.graphbio1.com/en/ (English version) and http://www.graphbio1.com/ (Chinese version). The source code of GraphBio is available at https://github.com/databio2022/GraphBio.
大量的组学数据被生成,并且通常需要复杂的可视化分析。这些分析往往需要编程技能,而这对实验生物学家来说是困难的。因此,迫切需要更用户友好的工具。在此,我们展示了GraphBio,一个用于轻松对组学数据进行可视化分析的闪亮网络应用程序。GraphBio提供15种流行的可视化分析方法,包括热图、火山图、MA图、网络图、点图、弦图、饼图、四象限图、维恩图、累积分布曲线、主成分分析(PCA)、生存分析、受试者工作特征(ROC)分析、相关性分析和文本聚类分析。它使没有编程技能的实验生物学家能够轻松进行流行的可视化分析并获得可用于发表的图表。GraphBio作为一个在线网络应用程序,可在http://www.graphbio1.com/en/(英文版)和http://www.graphbio1.com/(中文版)免费获取。GraphBio的源代码可在https://github.com/databio2022/GraphBio获取。