• 文献检索
  • 文档翻译
  • 深度研究
  • 学术资讯
  • Suppr Zotero 插件Zotero 插件
  • 邀请有礼
  • 套餐&价格
  • 历史记录
应用&插件
Suppr Zotero 插件Zotero 插件浏览器插件Mac 客户端Windows 客户端微信小程序
定价
高级版会员购买积分包购买API积分包
服务
文献检索文档翻译深度研究API 文档MCP 服务
关于我们
关于 Suppr公司介绍联系我们用户协议隐私条款
关注我们

Suppr 超能文献

核心技术专利:CN118964589B侵权必究
粤ICP备2023148730 号-1Suppr @ 2026

文献检索

告别复杂PubMed语法,用中文像聊天一样搜索,搜遍4000万医学文献。AI智能推荐,让科研检索更轻松。

立即免费搜索

文件翻译

保留排版,准确专业,支持PDF/Word/PPT等文件格式,支持 12+语言互译。

免费翻译文档

深度研究

AI帮你快速写综述,25分钟生成高质量综述,智能提取关键信息,辅助科研写作。

立即免费体验

自引率 Hirsch 指数与《巴尔的摩医学杂志》上的文章:2018 年至 2021 年两个阶段出版物的文献计量分析。

The Hirsch-index in self-citation rates with articles in Medicine (Baltimore): Bibliometric analysis of publications in two stages from 2018 to 2021.

机构信息

Department of Nutrition, Chi Mei Medical Center, Tainan, Taiwan.

Department of Nutrition and Health Sciences, Chang Jung Christian University, Tainan, Taiwan.

出版信息

Medicine (Baltimore). 2022 Nov 11;101(45):e31609. doi: 10.1097/MD.0000000000031609.

DOI:10.1097/MD.0000000000031609
PMID:36397355
原文链接:https://pmc.ncbi.nlm.nih.gov/articles/PMC9666158/
Abstract

BACKGROUND

The Hirsch-index (h-index) is a measure of academic productivity that incorporates both the quantity and quality of an author's output. However, it is still affected by self-citation behaviors. This study aims to determine the research output and self-citation rates (SCRs) in the Journal of Medicine (Baltimore), establishing a benchmark for bibliometrics, in addition to identifying significant differences between stages from 2018 to 2021.

METHODS

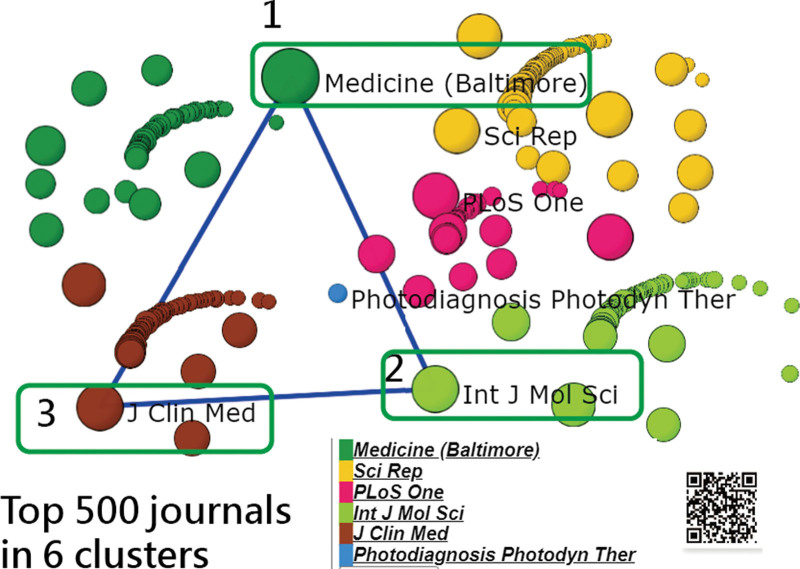
We searched the PubMed database to obtain 17,912 articles published between 2018 and 2021 in Medicine (Baltimore). Two parts were carried out to conduct this study: the categories were clustered according to the medical subject headings (denoted by midical subject headings [MeSH] terms) using social network analysis; 3 visualizations were used (choropleth map, forest plot, and Sankey diagram) to identify dominant entities (e.g., years, countries, regions, institutes, authors, categories, and document types); 2-way analysis of variance (ANOVA) was performed to differentiate outputs between entities and stages, and the SCR with articles in Medicine (Baltimore) was examined. SCR, as well as the proportion of self-citation (SC) in the previous 2 years in comparison to SC were computed.

RESULTS

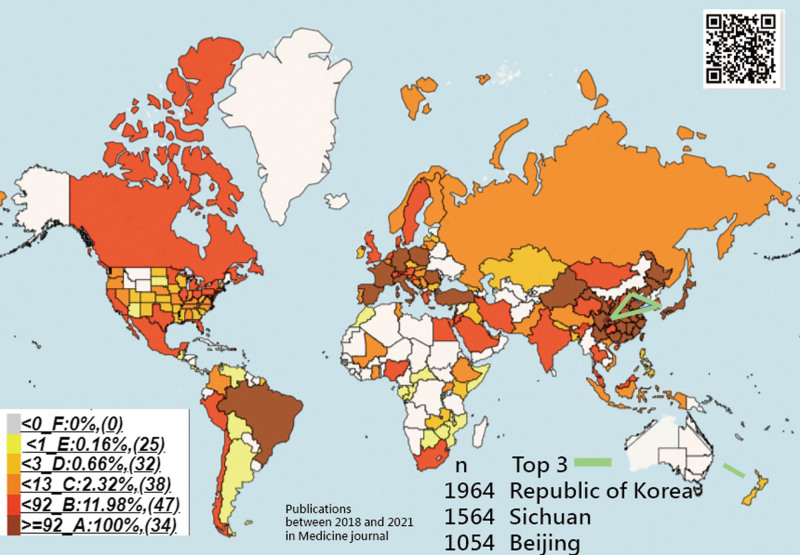
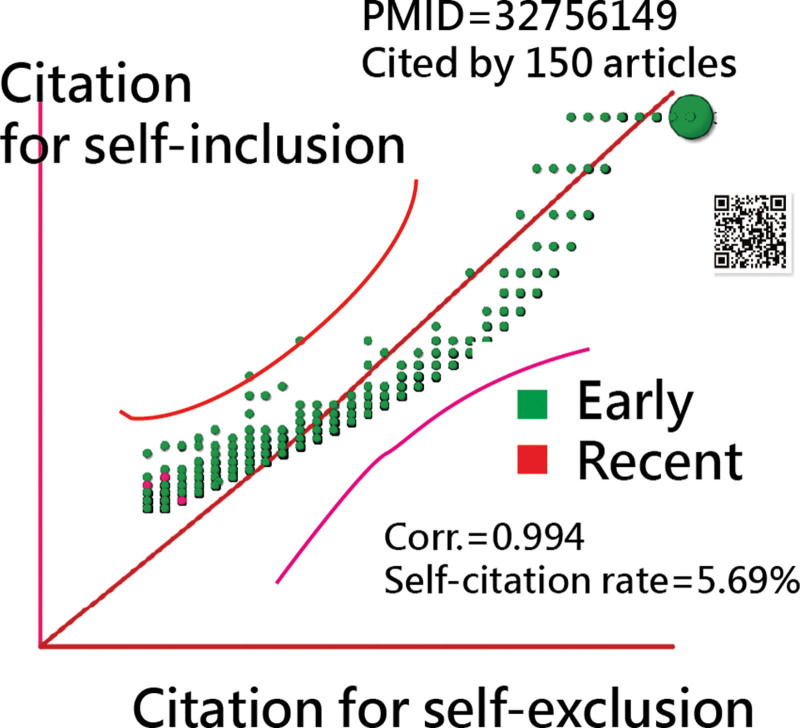
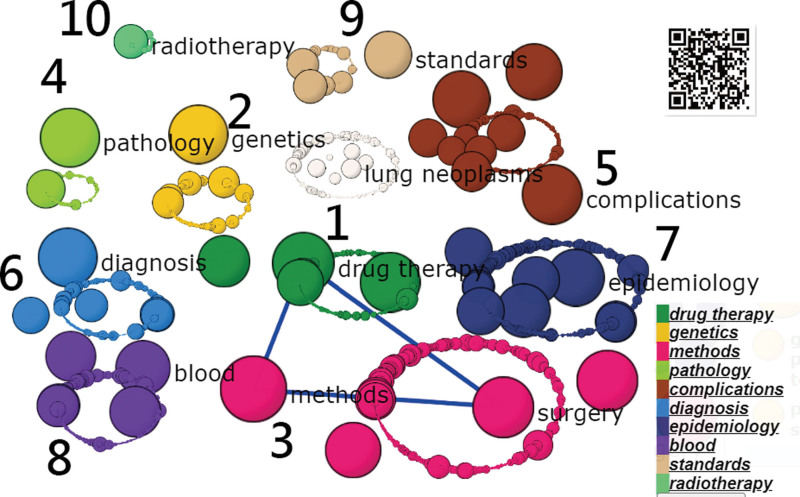
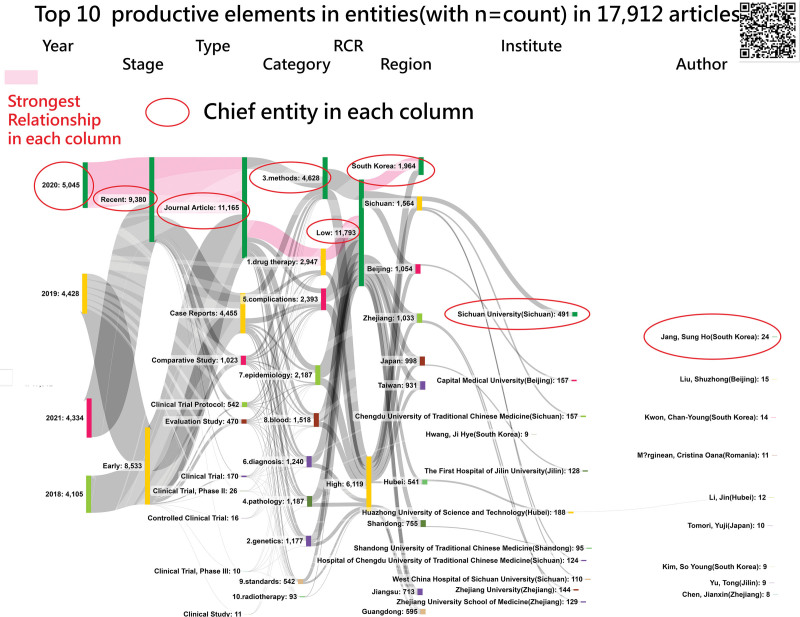
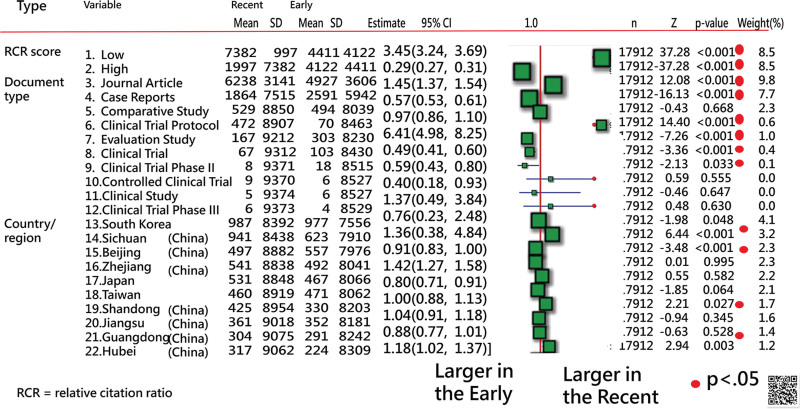
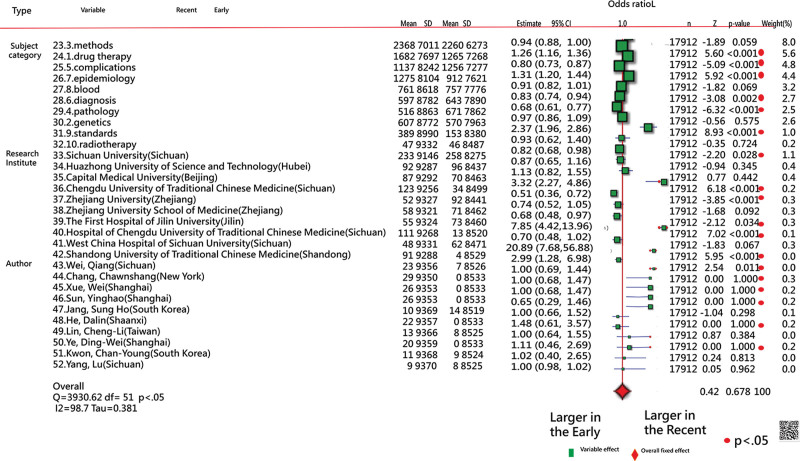
We found that South Korea, Sichuan (China), and Beijing (China) accounted for the majority of articles in Medicine (Baltimore); ten categories were clustered and led by 3 MeSh terms: methods, drug therapy, and complications; and more articles (52%) were in the recent stage (2020-2021); no significant difference in counts was observed between the 2 stages based on the top ten entities using the forest plot (Z = 0.05, P = .962) and 2-way ANOVA (F = 0.09, P = .76); the SCR was 5.69% (<15%); the h-index did not differ between the 2 collections of self-citation inclusion and exclusion; and the SC in the previous 2 years accounted for 70% of the self-citation exclusion.

CONCLUSION

By visualizing the characteristics of a given journal, a breakthrough was made. Subject categories can be classified using MeSH terms. Future bibliographical studies are recommended to perform the 2-way ANOVA and then compare the outputs from 2 stages as well as the changes in h-indexes between 2 sets of self-citation inclusion and exclusion.

摘要

背景

Hirsch 指数(h-index)是一种衡量学术产出的方法,它结合了作者产出的数量和质量。然而,它仍然受到自引行为的影响。本研究旨在确定《巴尔的摩医学杂志》(Journal of Medicine(Baltimore))的研究产出和自引率(SCR),为文献计量学建立基准,并确定 2018 年至 2021 年各阶段之间的显著差异。

方法

我们在 PubMed 数据库中检索了 2018 年至 2021 年期间发表在《巴尔的摩医学杂志》(Medicine(Baltimore))上的 17912 篇文章。本研究分两部分进行:使用社会网络分析按医学主题词(MeSH 术语)对类别进行聚类;使用 3 种可视化方法(区域图、森林图和桑基图)识别主要实体(如年份、国家、地区、机构、作者、类别和文件类型);使用双向方差分析(ANOVA)来区分实体和阶段之间的产出,并检查《巴尔的摩医学杂志》(Medicine(Baltimore))中的文章的 SCR。计算 SCR 以及与前两年自引(SC)的比例。

结果

我们发现,韩国、中国四川和北京占《巴尔的摩医学杂志》(Medicine(Baltimore))文章的大部分;10 个类别聚类,由 3 个 MeSH 术语主导:方法、药物治疗和并发症;更多的文章(52%)来自最近的阶段(2020-2021 年);基于前 10 个实体的森林图(Z=0.05,P=0.962)和双向 ANOVA(F=0.09,P=0.76),两个阶段之间的计数没有显著差异;SCR 为 5.69%(<15%);纳入和排除自我引用集之间的 h 指数没有差异;前两年的 SC 占自我引用排除的 70%。

结论

通过可视化给定期刊的特征,取得了突破。可以使用 MeSH 术语对主题类别进行分类。建议未来的文献研究进行双向 ANOVA,然后比较两个阶段的产出以及两个自我引用纳入和排除集之间的 h 指数变化。

https://cdn.ncbi.nlm.nih.gov/pmc/blobs/84d4/9666158/5620bce592f8/medi-101-e31609-g007.jpg
https://cdn.ncbi.nlm.nih.gov/pmc/blobs/84d4/9666158/4b8382a0d575/medi-101-e31609-g001.jpg
https://cdn.ncbi.nlm.nih.gov/pmc/blobs/84d4/9666158/dba14a08882a/medi-101-e31609-g002.jpg
https://cdn.ncbi.nlm.nih.gov/pmc/blobs/84d4/9666158/10cf08bbe3a7/medi-101-e31609-g003.jpg
https://cdn.ncbi.nlm.nih.gov/pmc/blobs/84d4/9666158/9b449190a9ab/medi-101-e31609-g004.jpg
https://cdn.ncbi.nlm.nih.gov/pmc/blobs/84d4/9666158/3dac928790db/medi-101-e31609-g005.jpg
https://cdn.ncbi.nlm.nih.gov/pmc/blobs/84d4/9666158/269ddd4f0f85/medi-101-e31609-g006.jpg
https://cdn.ncbi.nlm.nih.gov/pmc/blobs/84d4/9666158/5620bce592f8/medi-101-e31609-g007.jpg

相似文献

1
The Hirsch-index in self-citation rates with articles in Medicine (Baltimore): Bibliometric analysis of publications in two stages from 2018 to 2021.自引率 Hirsch 指数与《巴尔的摩医学杂志》上的文章:2018 年至 2021 年两个阶段出版物的文献计量分析。
Medicine (Baltimore). 2022 Nov 11;101(45):e31609. doi: 10.1097/MD.0000000000031609.
2
Predicting article citations using data of 100 top-cited publications in the journal Medicine since 2011: A bibliometric analysis.利用2011年以来《医学》杂志100篇高被引论文的数据预测论文引用情况:一项文献计量分析。
Medicine (Baltimore). 2020 Oct 30;99(44):e22885. doi: 10.1097/MD.0000000000022885.
3
Citation analysis of the 100 top-cited articles on the topic of hidradenitis suppurativa since 2013 using Sankey diagrams: Bibliometric analysis.利用桑基图对 2013 年以来关于化脓性汗腺炎主题的 100 篇高被引论文进行引文分析:文献计量分析。
Medicine (Baltimore). 2022 Nov 4;101(44):e31144. doi: 10.1097/MD.0000000000031144.
4
Citation analysis of the 100 top-cited articles on discectomy via endoscopy since 2011 using alluvial diagrams: bibliometric analysis.2011 年以来经内镜椎间盘切除术 100 篇高引文献的引文分析:文献计量学分析。
Eur J Med Res. 2022 Sep 1;27(1):169. doi: 10.1186/s40001-022-00782-0.
5
Using the Sankey diagram to visualize article features on the topics of whole-exome sequencing (WES) and whole-genome sequencing (WGS) since 2012: Bibliometric analysis.运用桑基图可视化 2012 年以来全外显子组测序(WES)和全基因组测序(WGS)主题的文章特征:文献计量分析。
Medicine (Baltimore). 2022 Sep 23;101(38):e30682. doi: 10.1097/MD.0000000000030682.
6
The Hirsch Index and Self-Citation in Academic Physiatry Among Graduate Medical Education Program Directors.《在研究生医学教育项目主任中,学术物理治疗中的 Hirsch 指数和自引》。
Am J Phys Med Rehabil. 2022 Mar 1;101(3):294-297. doi: 10.1097/PHM.0000000000001902.
7
Predicting article citations using data from 100 top-cited publications in the field of Psoriasis Vulgaris and biological agents (PVBA) since 1991: A bibliometric analysis.预测 1991 年以来在银屑病和生物制剂(PVBA)领域的 100 篇高引文献数据中的文章引用量:文献计量分析。
Medicine (Baltimore). 2022 Jul 29;101(30):e29396. doi: 10.1097/MD.0000000000029396.
8
The use of radar plots with the Yk-index to identify which authors contributed the most to the journal of Medicine in 2020 and 2021: A bibliometric analysis.使用雷达图和 Yk 指数来确定哪些作者对 2020 年和 2021 年的《医学杂志》做出了最大贡献:一项文献计量学分析。
Medicine (Baltimore). 2022 Nov 11;101(45):e31033. doi: 10.1097/MD.0000000000031033.
9
Trend and prediction of citations on the topic of neuromuscular junctions in 100 top-cited articles since 2001 using a temporal bar graph: A bibliometric analysis.使用时间条形图分析 2001 年以来 100 篇高引论文中神经肌肉接头主题的引文趋势和预测:文献计量分析。
Medicine (Baltimore). 2022 Oct 7;101(40):e30674. doi: 10.1097/MD.0000000000030674.
10
Using the alluvial plot to visualize the network characteristics of 100 top-cited articles on attention-deficit/hyperactivity disorder (ADHD) since 2011: Bibliometric analysis.利用沉积图可视化自 2011 年以来关于注意力缺陷/多动障碍(ADHD)的 100 篇高引文章的网络特征:文献计量分析。
Medicine (Baltimore). 2022 Sep 16;101(37):e30545. doi: 10.1097/MD.0000000000030545.

引用本文的文献

1
Enhancing English abstract quality for non-English speaking authors using ChatGPT: A comparative study of Taiwan, Japan, China, and South Korea with slope graphs.利用 ChatGPT 提高非英语母语作者英文摘要质量:使用斜率图对中国台湾、日本、中国和韩国进行的比较研究。
Medicine (Baltimore). 2024 Oct 4;103(40):e39796. doi: 10.1097/MD.0000000000039796.
2
Mapping out the bibliometric characteristics of published in a Taiwanese academic journal in dentistry: A scopus-based analysis.梳理一本台湾牙科学术期刊发表文献的文献计量学特征:基于Scopus的分析。
J Dent Sci. 2023 Oct;18(4):1493-1509. doi: 10.1016/j.jds.2023.03.015. Epub 2023 Apr 6.
3
Analyzing author collaborations by developing a follower-leader clustering algorithm and identifying top co-authoring countries: Cluster analysis.
通过开发追随者-领导者聚类算法和识别顶级合作国家来分析作者合作:聚类分析。
Medicine (Baltimore). 2023 Jul 21;102(29):e34158. doi: 10.1097/MD.0000000000034158.
4
Using Rasch KIDMAP to identify whether China dominates the research area of computer science (CS) based on the specialization index of article citations: Bibliometric analysis.基于论文引文的专业化指数,利用 Rasch KIDMAP 来识别中国是否主导计算机科学(CS)的研究领域:文献计量分析。
Medicine (Baltimore). 2023 May 19;102(20):e33835. doi: 10.1097/MD.0000000000033835.
5
The ascendancy of research in acronyms related to COVID-19 displayed on a growth-share matrix (GSM): Bibliometric analysis.COVID-19 相关缩略语研究的崛起在增长份额矩阵(GSM)上的表现:文献计量分析。
Medicine (Baltimore). 2023 Apr 25;102(17):e33626. doi: 10.1097/MD.0000000000033626.
6
Using chord diagrams to explore article themes in 100 top-cited articles citing Hirsch's h-index since 2005: A bibliometric analysis.使用和弦图探索 2005 年以来引用 Hirsch 的 h 指数的 100 篇高引文章中的文章主题:一项文献计量分析。
Medicine (Baltimore). 2023 Feb 22;102(8):e33057. doi: 10.1097/MD.0000000000033057.