The Francis Crick Institute, London, NW1 4AT, United Kingdom
The Francis Crick Institute, London, NW1 4AT, United Kingdom.
RNA. 2023 Jun;29(6):715-723. doi: 10.1261/rna.079326.122. Epub 2023 Mar 9.
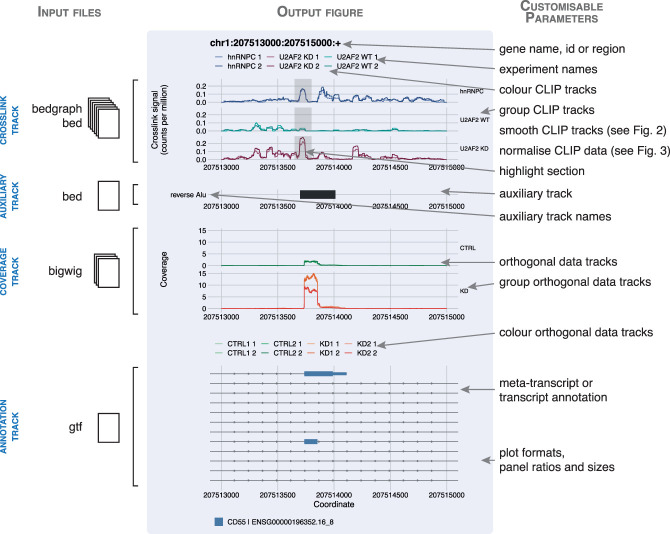
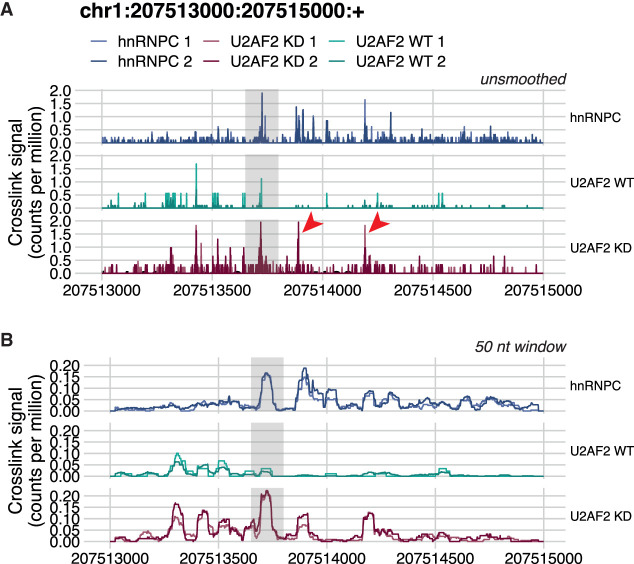
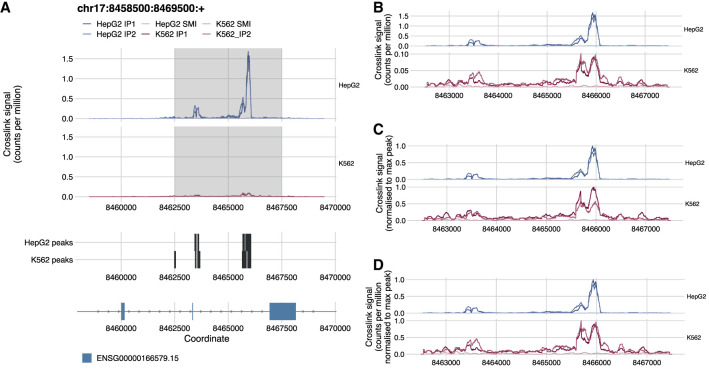
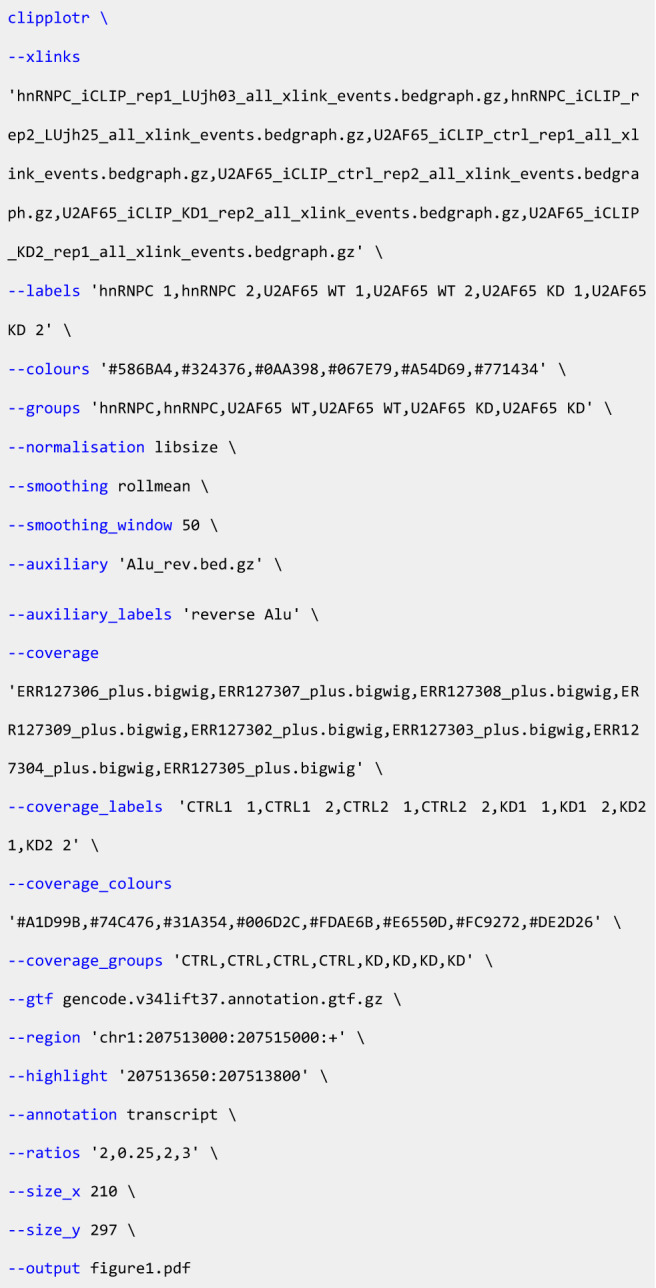
CLIP technologies are now widely used to study RNA-protein interactions and many data sets are now publicly available. An important first step in CLIP data exploration is the visual inspection and assessment of processed genomic data on selected genes or regions and performing comparisons: either across conditions within a particular project, or incorporating publicly available data. However, the output files produced by data processing pipelines or preprocessed files available to download from data repositories are often not suitable for direct comparison and usually need further processing. Furthermore, to derive biological insight it is usually necessary to visualize a CLIP signal alongside other data such as annotations, or orthogonal functional genomic data (e.g., RNA-seq). We have developed a simple, but powerful, command-line tool: , which facilitates these visual comparative and integrative analyses with normalization and smoothing options for CLIP data and the ability to show these alongside reference annotation tracks and functional genomic data. These data can be supplied as input to in a range of file formats, which will output a publication quality figure. It is written in R and can both run on a laptop computer independently or be integrated into computational workflows on a high-performance cluster. Releases, source code, and documentation are freely available at https://github.com/ulelab/clipplotr.
CLIP 技术现在被广泛用于研究 RNA-蛋白质相互作用,并且现在有许多数据集可供公开使用。在 CLIP 数据探索的重要的第一步是对选定基因或区域的处理后的基因组数据进行可视化检查和评估,并进行比较:要么在特定项目内的条件之间进行比较,要么整合公开可用的数据。然而,数据处理管道生成的输出文件或从数据存储库下载的预处理文件通常不适合直接比较,通常需要进一步处理。此外,为了得出生物学见解,通常需要将 CLIP 信号与其他数据(例如注释或正交功能基因组数据(例如 RNA-seq))一起可视化。我们开发了一种简单但功能强大的命令行工具: ,它通过对 CLIP 数据进行标准化和平滑处理,以及能够与参考注释轨道和功能基因组数据一起显示这些数据,从而促进这些可视化的比较和综合分析。这些数据可以以多种文件格式输入到 中,它将输出具有出版质量的图形。它是用 R 编写的,可以在笔记本电脑上独立运行,也可以集成到高性能集群上的计算工作流程中。版本、源代码和文档可在 https://github.com/ulelab/clipplotr 上免费获取。