• 文献检索
  • 文档翻译
  • 深度研究
  • 学术资讯
  • Suppr Zotero 插件Zotero 插件
  • 邀请有礼
  • 套餐&价格
  • 历史记录
应用&插件
Suppr Zotero 插件Zotero 插件浏览器插件Mac 客户端Windows 客户端微信小程序
定价
高级版会员购买积分包购买API积分包
服务
文献检索文档翻译深度研究API 文档MCP 服务
关于我们
关于 Suppr公司介绍联系我们用户协议隐私条款
关注我们

Suppr 超能文献

核心技术专利:CN118964589B侵权必究
粤ICP备2023148730 号-1Suppr @ 2026

文献检索

告别复杂PubMed语法,用中文像聊天一样搜索,搜遍4000万医学文献。AI智能推荐,让科研检索更轻松。

立即免费搜索

文件翻译

保留排版,准确专业,支持PDF/Word/PPT等文件格式,支持 12+语言互译。

免费翻译文档

深度研究

AI帮你快速写综述,25分钟生成高质量综述,智能提取关键信息,辅助科研写作。

立即免费体验

软件应用程序配置文件:daggle 应用程序——一种支持使用有向无环图学习和教授选择调整变量的图形规则的工具。

Software Application Profile: The daggle app-a tool to support learning and teaching the graphical rules of selecting adjustment variables using directed acyclic graphs.

机构信息

Centre for Big Data Research in Health, UNSW Sydney, Sydney, NSW, Australia.

National Perinatal Epidemiology and Statistics Unit, School of Clinical Medicine, UNSW Sydney, Sydney, NSW, Australia.

出版信息

Int J Epidemiol. 2023 Oct 5;52(5):1659-1664. doi: 10.1093/ije/dyad038.

DOI:10.1093/ije/dyad038
PMID:36952629
原文链接:https://pmc.ncbi.nlm.nih.gov/articles/PMC10555701/
Abstract

MOTIVATION

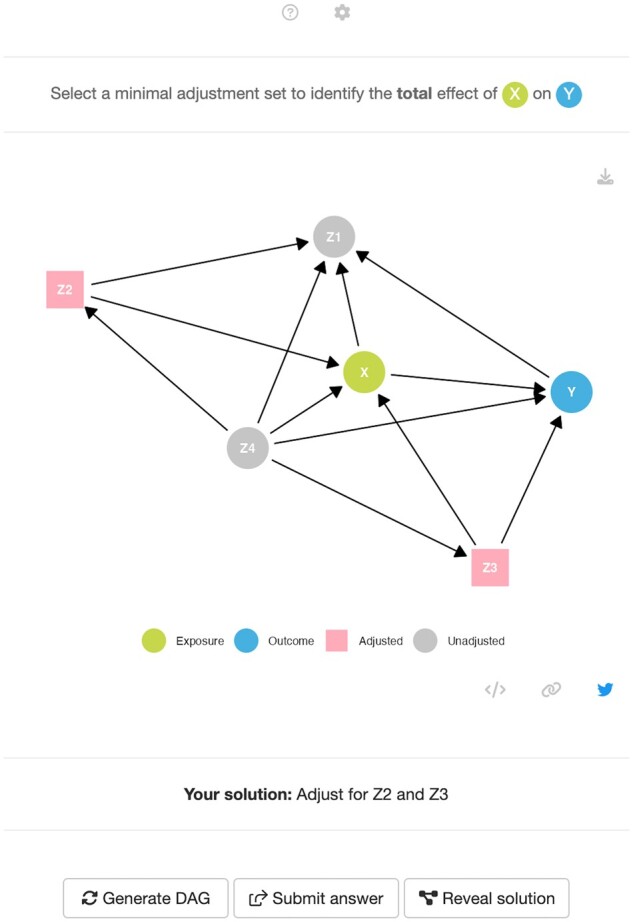
Directed acyclic graphs (DAGs) are used in epidemiological research to communicate causal assumptions and guide the selection of covariate adjustment sets when estimating causal effects. For any given DAG, a set of graphical rules can be applied to identify minimally sufficient adjustment sets that can be used to adjust for bias due to confounding when estimating the causal effect of an exposure on an outcome. The daggle app is a web-based application that aims to assist in the learning and teaching of adjustment set identification using DAGs.

GENERAL FEATURES

The application offers two modes: tutorial and random. The tutorial mode presents a guided introduction to how common causal structures can be presented using DAGs and how graphical rules can be used to identify minimally sufficient adjustment sets for causal estimation. The random mode tests this understanding by presenting the user with a randomly generated DAG-a daggle. To solve the daggle, users must correctly identify a valid minimally sufficient adjustment set.

IMPLEMENTATION

The daggle app is implemented as an R shiny application using the golem framework. The application builds upon existing R libraries including pcalg to generate reproducible random DAGs, dagitty to identify all valid minimal adjustment sets and ggdag to visualize DAGs.

AVAILABILITY

The daggle app can be accessed online at [http://cbdrh.shinyapps.io/daggle]. The source code is available on GitHub [https://github.com/CBDRH/daggle] and is released under a Creative Commons CC BY-NC-SA 4.0 licence.

摘要

动机

有向无环图 (DAG) 用于流行病学研究中,用于传达因果假设,并在估计因果效应时指导协变量调整集的选择。对于任何给定的 DAG,可以应用一组图形规则来识别最小充分调整集,这些调整集可用于调整因混杂引起的偏差,以估计暴露对结果的因果效应。daggle 应用程序是一个基于网络的应用程序,旨在帮助学习和教授使用 DAG 进行调整集识别。

一般特征

该应用程序提供两种模式:教程和随机。教程模式提供了一个关于如何使用 DAG 呈现常见因果结构以及如何使用图形规则识别用于因果估计的最小充分调整集的指导介绍。随机模式通过向用户呈现一个随机生成的 DAG-a daggle 来测试这种理解。要解决 daggle,用户必须正确识别有效的最小充分调整集。

实现

daggle 应用程序是使用 golem 框架作为 R shiny 应用程序实现的。该应用程序建立在现有的 R 库之上,包括 pcalg 来生成可重现的随机 DAG、dagitty 来识别所有有效的最小调整集和 ggdag 来可视化 DAG。

可用性

daggle 应用程序可以在线访问[http://cbdrh.shinyapps.io/daggle]。源代码可在 GitHub[https://github.com/CBDRH/daggle]上获得,并根据知识共享 CC BY-NC-SA 4.0 许可证发布。

https://cdn.ncbi.nlm.nih.gov/pmc/blobs/eb5c/10555701/79a12e07974b/dyad038f3.jpg
https://cdn.ncbi.nlm.nih.gov/pmc/blobs/eb5c/10555701/508a8782cc32/dyad038f1.jpg
https://cdn.ncbi.nlm.nih.gov/pmc/blobs/eb5c/10555701/927dba7faf78/dyad038f2.jpg
https://cdn.ncbi.nlm.nih.gov/pmc/blobs/eb5c/10555701/79a12e07974b/dyad038f3.jpg
https://cdn.ncbi.nlm.nih.gov/pmc/blobs/eb5c/10555701/508a8782cc32/dyad038f1.jpg
https://cdn.ncbi.nlm.nih.gov/pmc/blobs/eb5c/10555701/927dba7faf78/dyad038f2.jpg
https://cdn.ncbi.nlm.nih.gov/pmc/blobs/eb5c/10555701/79a12e07974b/dyad038f3.jpg

相似文献

1
Software Application Profile: The daggle app-a tool to support learning and teaching the graphical rules of selecting adjustment variables using directed acyclic graphs.软件应用程序配置文件:daggle 应用程序——一种支持使用有向无环图学习和教授选择调整变量的图形规则的工具。
Int J Epidemiol. 2023 Oct 5;52(5):1659-1664. doi: 10.1093/ije/dyad038.
2
Robust causal inference using directed acyclic graphs: the R package 'dagitty'.使用有向无环图进行稳健的因果推断:R包“dagitty”
Int J Epidemiol. 2016 Dec 1;45(6):1887-1894. doi: 10.1093/ije/dyw341.
3
[Directed acyclic graphs (DAGs) - the application of causal diagrams in epidemiology].[有向无环图(DAGs)——因果图在流行病学中的应用]
Gesundheitswesen. 2011 Dec;73(12):888-92. doi: 10.1055/s-0031-1291192. Epub 2011 Dec 22.
4
Use of directed acyclic graphs (DAGs) to identify confounders in applied health research: review and recommendations.应用健康研究中使用有向无环图(DAG)识别混杂因素:综述与建议。
Int J Epidemiol. 2021 May 17;50(2):620-632. doi: 10.1093/ije/dyaa213.
5
Combining directed acyclic graphs and the change-in-estimate procedure as a novel approach to adjustment-variable selection in epidemiology.将有向无环图和估计量变化方法相结合,作为一种新的流行病学调整变量选择方法。
BMC Med Res Methodol. 2012 Oct 11;12:156. doi: 10.1186/1471-2288-12-156.
6
Testing Graphical Causal Models Using the R Package "dagitty".使用 R 包“dagitty”测试图形因果模型。
Curr Protoc. 2021 Feb;1(2):e45. doi: 10.1002/cpz1.45.
7
Tutorial on directed acyclic graphs.有向无环图教程。
J Clin Epidemiol. 2022 Feb;142:264-267. doi: 10.1016/j.jclinepi.2021.08.001. Epub 2021 Aug 8.
8
DAG With Omitted Objects Displayed (DAGWOOD): a framework for revealing causal assumptions in DAGs.显示省略对象的有向无环图(DAGWOOD):一种揭示有向无环图中因果假设的框架。
Ann Epidemiol. 2022 Apr;68:64-71. doi: 10.1016/j.annepidem.2022.01.001. Epub 2022 Feb 3.
9
Evidence synthesis for constructing directed acyclic graphs (ESC-DAGs): a novel and systematic method for building directed acyclic graphs.证据综合构建有向无环图(ESC-DAGs):一种构建有向无环图的新颖而系统的方法。
Int J Epidemiol. 2020 Feb 1;49(1):322-329. doi: 10.1093/ije/dyz150.
10
Causal Diagrams: Pitfalls and Tips.因果图:陷阱与技巧。
J Epidemiol. 2020 Apr 5;30(4):153-162. doi: 10.2188/jea.JE20190192. Epub 2020 Feb 1.

引用本文的文献

1
Calculating preventable risk fractions for exposure-reducing interventions.计算降低暴露干预措施的可预防风险分数。
Glob Epidemiol. 2025 May 7;9:100206. doi: 10.1016/j.gloepi.2025.100206. eCollection 2025 Jun.

本文引用的文献

1
Reflection on modern methods: constructing directed acyclic graphs (DAGs) with domain experts for health services research.反思现代方法:为卫生服务研究构建有领域专家参与的有向无环图(DAGs)。
Int J Epidemiol. 2022 Aug 10;51(4):1339-1348. doi: 10.1093/ije/dyac135.
2
A proposal for capturing interaction and effect modification using DAGs.一种使用有向无环图来捕捉交互作用和效应修正的提议。
Int J Epidemiol. 2022 Aug 10;51(4):1047-1053. doi: 10.1093/ije/dyac126.
3
Illustrating How to Simulate Data From Directed Acyclic Graphs to Understand Epidemiologic Concepts.
演示如何从有向无环图模拟数据,以理解流行病学概念。
Am J Epidemiol. 2022 Jun 27;191(7):1300-1306. doi: 10.1093/aje/kwac041.
4
Reflection on modern methods: understanding bias and data analytical strategies through DAG-based data simulations.对现代方法的反思:通过基于有向无环图(DAG)的数据模拟理解偏差和数据分析策略。
Int J Epidemiol. 2022 Jan 6;50(6):2091-2097. doi: 10.1093/ije/dyab096. Epub 2021 May 10.
5
Tutorial on directed acyclic graphs.有向无环图教程。
J Clin Epidemiol. 2022 Feb;142:264-267. doi: 10.1016/j.jclinepi.2021.08.001. Epub 2021 Aug 8.
6
Use of directed acyclic graphs (DAGs) to identify confounders in applied health research: review and recommendations.应用健康研究中使用有向无环图(DAG)识别混杂因素:综述与建议。
Int J Epidemiol. 2021 May 17;50(2):620-632. doi: 10.1093/ije/dyaa213.
7
Directed Acyclic Graphs, Effect Measure Modification, and Generalizability.有向无环图、效应修正和可推广性。
Am J Epidemiol. 2021 Feb 1;190(2):322-327. doi: 10.1093/aje/kwaa185.
8
Using Causal Diagrams to Improve the Design and Interpretation of Medical Research.使用因果关系图改进医学研究的设计与解读
Chest. 2020 Jul;158(1S):S21-S28. doi: 10.1016/j.chest.2020.03.011.
9
The effect of challenge-based gamification on learning: An experiment in the context of statistics education.基于挑战的游戏化对学习的影响:一项统计学教育背景下的实验。
Int J Hum Comput Stud. 2020 Dec;144:102496. doi: 10.1016/j.ijhcs.2020.102496. Epub 2020 Jun 14.
10
Principles of confounder selection.混杂因素选择原则。
Eur J Epidemiol. 2019 Mar;34(3):211-219. doi: 10.1007/s10654-019-00494-6. Epub 2019 Mar 6.