• 文献检索
  • 文档翻译
  • 深度研究
  • 学术资讯
  • Suppr Zotero 插件Zotero 插件
  • 邀请有礼
  • 套餐&价格
  • 历史记录
应用&插件
Suppr Zotero 插件Zotero 插件浏览器插件Mac 客户端Windows 客户端微信小程序
定价
高级版会员购买积分包购买API积分包
服务
文献检索文档翻译深度研究API 文档MCP 服务
关于我们
关于 Suppr公司介绍联系我们用户协议隐私条款
关注我们

Suppr 超能文献

核心技术专利:CN118964589B侵权必究
粤ICP备2023148730 号-1Suppr @ 2026

文献检索

告别复杂PubMed语法,用中文像聊天一样搜索,搜遍4000万医学文献。AI智能推荐,让科研检索更轻松。

立即免费搜索

文件翻译

保留排版,准确专业,支持PDF/Word/PPT等文件格式,支持 12+语言互译。

免费翻译文档

深度研究

AI帮你快速写综述,25分钟生成高质量综述,智能提取关键信息,辅助科研写作。

立即免费体验

分析 2008 年至 2018 年中国结核病的时空动态分布及相关因素。

Analysis of spatial-temporal dynamic distribution and related factors of tuberculosis in China from 2008 to 2018.

机构信息

School of Public Health, Guangdong Medical University, Dongguan, Guangdong Province, China.

Pension Industry Research Institute, Guangdong Medical University, Dongguan, Guangdong Province, China.

出版信息

Sci Rep. 2023 Mar 27;13(1):4974. doi: 10.1038/s41598-023-31430-0.

DOI:10.1038/s41598-023-31430-0
PMID:36973322
原文链接:https://pmc.ncbi.nlm.nih.gov/articles/PMC10041483/
Abstract

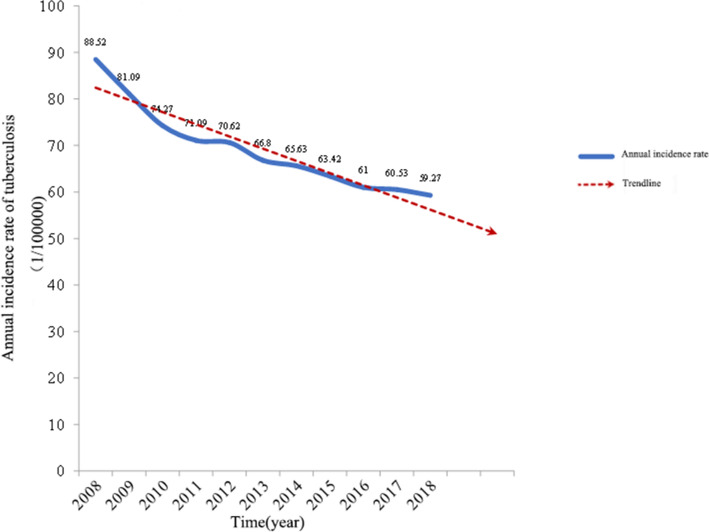
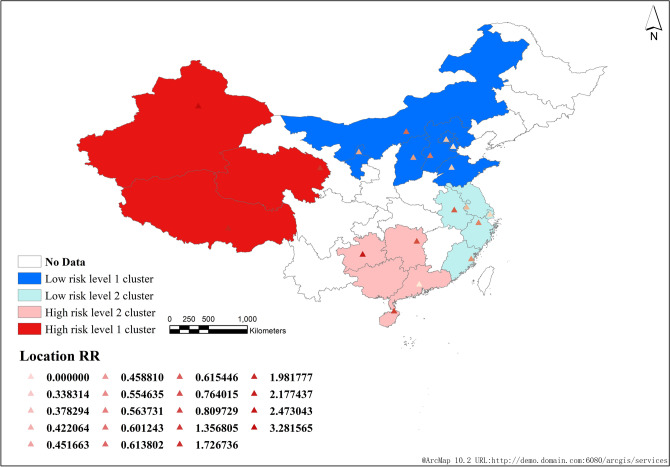
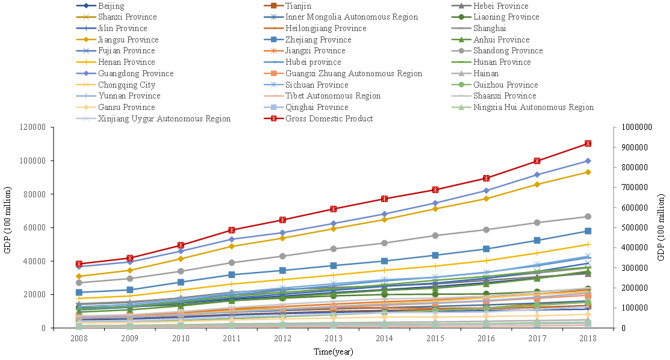
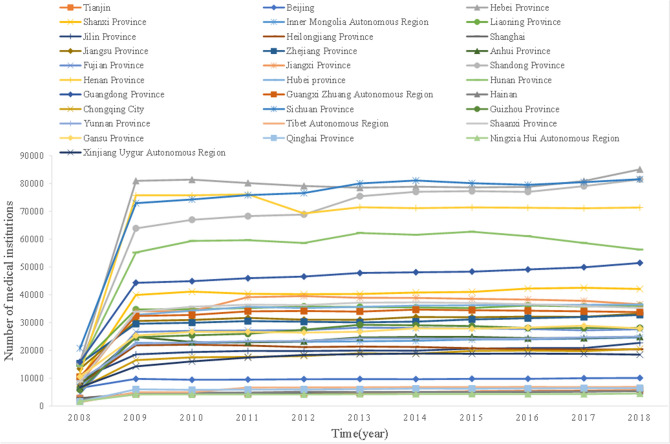
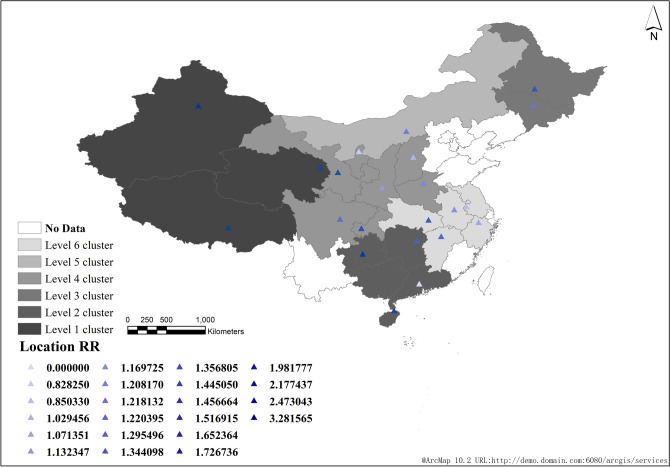
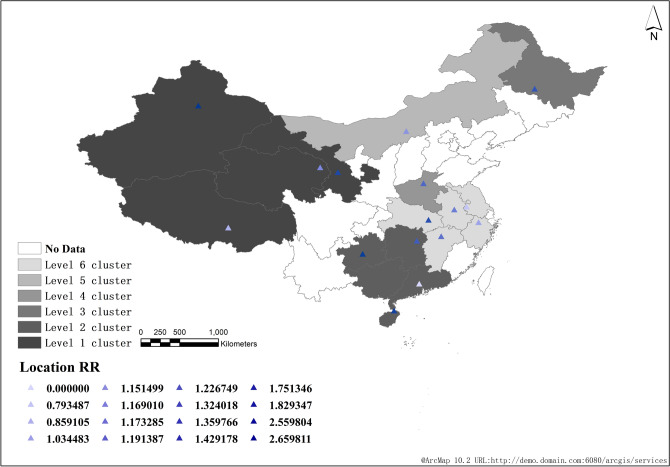
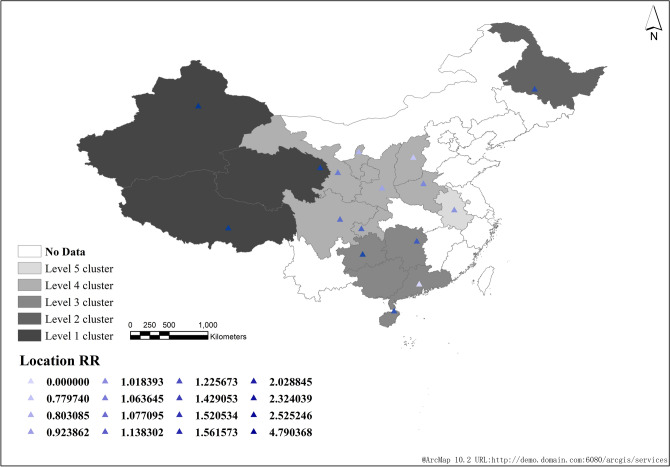
Through spatial-temporal scanning statistics, the spatial-temporal dynamic distribution of pulmonary tuberculosis incidence in 31 provinces and autonomous regions of China from 2008 to 2018 is obtained, and the related factors of spatial-temporal aggregation of tuberculosis in China are analyzed to provide strong scientific basis and data support for the prevention and control of pulmonary tuberculosis. This is a retrospective study, using spatial epidemiological methods to reveal the spatial-temporal clustering distribution characteristics of China's tuberculosis epidemic from 2008 to 2018, in which cases data comes from the China Center for Disease Control and prevention. Office Excel is used for general statistical description, and the single factor correlation analysis adopts χ Test (or trend χ Inspection). Retrospective discrete Poisson distribution space time scanning statistics of SaTScan 9.6 software are used to analyze the space time dynamic distribution of tuberculosis incidence in 31 provinces, cities and autonomous regions in China from 2008 to 2018. ArcGIS 10.2 software is used to visualize the results. The global spatial autocorrelation analysis adopts Moran's I of ArcGIS Map(Monte Carlo randomization simulation times of 999) is used to analyze high-risk areas, low-risk areas and high-low risk areas. From 2008 to 2018, 10,295,212 cases of pulmonary tuberculosis were reported in China, with an average annual incidence rate of 69.29/100,000 (95% CI: (69.29 ± 9.16)/100,000). The annual GDP (gross domestic product) of each province and city showed an upward trend year by year, and the number of annual medical institutions in each province and city showed a sharp increase in 2009, and then tended to be stable; From 2008 to 2018, the national spatiotemporal scanning statistics scanned a total of 6 clusters, including 23 provinces and cities. The national high-low spatiotemporal scanning statistics of the number of pulmonary tuberculosis cases scanned a total of 2 high-risk and low-risk clusters. The high-risk cluster included 8 provinces and cities, and the low-risk cluster included 12 provinces and cities. The global autocorrelation Moran's I index of the incidence rate of pulmonary tuberculosis in all provinces and cities was greater than the expected value (E (I) = -0.0333); The correlation analysis between the average annual GDP and the number of pulmonary tuberculosis cases in each province and city from 2008 to 2018 was statistically significant. From 2008 to 2018, the spatial and temporal scanning and statistical scanning areas of tuberculosis incidence in China were mainly concentrated in the northwest and southern regions of China. There is an obvious positive spatial correlation between the annual GDP distribution of each province and city, and the aggregation degree of the development level of each province and city is increasing year by year. There is a correlation between the average annual GDP of each province and the number of tuberculosis cases in the cluster area. There is no correlation between the number of medical institutions set up in each province and city and the number of pulmonary tuberculosis cases.

摘要

通过时空扫描统计,获得了 2008 年至 2018 年中国 31 个省、自治区和直辖市肺结核发病率的时空动态分布,并分析了中国结核病时空聚集的相关因素,为肺结核的预防和控制提供了有力的科学依据和数据支持。这是一项回顾性研究,采用空间流行病学方法揭示了 2008 年至 2018 年中国结核病疫情的时空聚集分布特征,其中病例数据来自中国疾病预防控制中心。使用 Office Excel 进行一般统计描述,单因素相关性分析采用 χ 检验(或趋势 χ 检验)。使用 SaTScan 9.6 软件进行回顾性离散泊松分布时空扫描统计,分析 2008 年至 2018 年中国 31 个省、市、自治区肺结核发病率的时空动态分布。使用 ArcGIS 10.2 软件可视化结果。采用 ArcGIS Map 的 Moran's I 的全局空间自相关分析(蒙特卡罗随机化模拟次数为 999)来分析高风险区、低风险区和高低风险区。2008 年至 2018 年,中国共报告肺结核病例 1029.5212 万例,年均发病率为 69.29/10 万(95%CI:(69.29±9.16)/10 万)。各省、市、区的年度国内生产总值(GDP)呈逐年上升趋势,各年的医疗机构数量在 2009 年大幅增加,然后趋于稳定;2008 年至 2018 年,全国时空扫描统计共扫描出 6 个聚集区,包括 23 个省、市。全国肺结核病例高低时空扫描统计共扫描出 2 个高风险和低风险聚集区。高风险集群包括 8 个省、市,低风险集群包括 12 个省、市。全国各省市肺结核发病率的全局自相关 Moran's I 指数大于预期值(E(I)=−0.0333);2008 年至 2018 年,各省、市、区 GDP 与肺结核病例数的相关分析具有统计学意义。2008 年至 2018 年,中国肺结核发病率的时空扫描和统计扫描区主要集中在中国的西北部和南部地区。各省、市、区 GDP 分布存在明显的正空间相关,各省、市、区发展水平的聚集程度逐年增加。各省、市、区的 GDP 年度平均值与结核病病例的聚集区呈正相关。各省、市、区医疗机构数量的设置与肺结核病例数无相关性。

https://cdn.ncbi.nlm.nih.gov/pmc/blobs/2e0e/10042833/96c281e03c8f/41598_2023_31430_Fig7_HTML.jpg
https://cdn.ncbi.nlm.nih.gov/pmc/blobs/2e0e/10042833/d480b4cf2950/41598_2023_31430_Fig1_HTML.jpg
https://cdn.ncbi.nlm.nih.gov/pmc/blobs/2e0e/10042833/81c5dd6081bd/41598_2023_31430_Fig2_HTML.jpg
https://cdn.ncbi.nlm.nih.gov/pmc/blobs/2e0e/10042833/9f799773f777/41598_2023_31430_Fig3_HTML.jpg
https://cdn.ncbi.nlm.nih.gov/pmc/blobs/2e0e/10042833/9b03ff0cd41c/41598_2023_31430_Fig4_HTML.jpg
https://cdn.ncbi.nlm.nih.gov/pmc/blobs/2e0e/10042833/60730e68d6e4/41598_2023_31430_Fig5_HTML.jpg
https://cdn.ncbi.nlm.nih.gov/pmc/blobs/2e0e/10042833/ffcdde197c2c/41598_2023_31430_Fig6_HTML.jpg
https://cdn.ncbi.nlm.nih.gov/pmc/blobs/2e0e/10042833/96c281e03c8f/41598_2023_31430_Fig7_HTML.jpg

相似文献

1
Analysis of spatial-temporal dynamic distribution and related factors of tuberculosis in China from 2008 to 2018.分析 2008 年至 2018 年中国结核病的时空动态分布及相关因素。
Sci Rep. 2023 Mar 27;13(1):4974. doi: 10.1038/s41598-023-31430-0.
2
[Spatial-temporal distribution characteristics of etiologically positive pulmonary tuberculosis in Jiangsu Province from 2011 to 2021].2011 - 2021年江苏省病原学阳性肺结核的时空分布特征
Zhonghua Liu Xing Bing Xue Za Zhi. 2024 Apr 10;45(4):513-519. doi: 10.3760/cma.j.cn112338-20230915-00161.
3
[Temporal-spatial distribution of tuberculosis in China, 2004-2016].[2004 - 2016年中国结核病的时空分布]
Zhonghua Liu Xing Bing Xue Za Zhi. 2020 Apr 10;41(4):526-531. doi: 10.3760/cma.j.cn112338-20190614-00441.
4
[Spatial distribution characteristics of tuberculosis and its visualization in Qinghai province, 2014-2016].[2014 - 2016年青海省结核病的空间分布特征及其可视化]
Zhonghua Liu Xing Bing Xue Za Zhi. 2018 Mar 10;39(3):347-351. doi: 10.3760/cma.j.issn.0254-6450.2018.03.019.
5
[Spatial-temporal distribution of smear positive pulmonary tuberculosis in Liangshan Yi autonomous prefecture, Sichuan province, 2011-2016].[2011 - 2016年四川省凉山彝族自治州涂阳肺结核的时空分布]
Zhonghua Liu Xing Bing Xue Za Zhi. 2017 Nov 10;38(11):1518-1522. doi: 10.3760/cma.j.issn.0254-6450.2017.11.016.
6
Spatio-temporal distribution characteristics of COVID-19 in China: a city-level modeling study.中国新冠肺炎的时空分布特征:一项城市层面的建模研究
BMC Infect Dis. 2021 Aug 14;21(1):816. doi: 10.1186/s12879-021-06515-8.
7
Spatial-temporal analysis of pulmonary tuberculosis in Hubei Province, China, 2011-2021.中国湖北省 2011-2021 年肺结核的时空分析。
PLoS One. 2023 Feb 7;18(2):e0281479. doi: 10.1371/journal.pone.0281479. eCollection 2023.
8
[Spatial-temporal cluster of hemorrhagic fever with renal syndrome in Hebei province, 2005-2016].[2005 - 2016年河北省肾综合征出血热的时空聚集性]
Zhonghua Liu Xing Bing Xue Za Zhi. 2019 Aug 10;40(8):930-935. doi: 10.3760/cma.j.issn.0254-6450.2019.08.011.
9
[Spatiotemporal distribution of measles in China, 2001-2016].[2001 - 2016年中国麻疹的时空分布]
Zhonghua Liu Xing Bing Xue Za Zhi. 2021 Apr 10;42(4):608-612. doi: 10.3760/cma.j.cn112338-20200317-00370.
10
Epidemiological Characteristics and Spatiotemporal Clustering of Pulmonary Tuberculosis Among Students in Southwest China From 2016 to 2022: Analysis of Population-Based Surveillance Data.2016 年至 2022 年中国西南地区学生人群肺结核的流行病学特征及时空聚集性分析:基于人群的监测数据分析。
JMIR Public Health Surveill. 2024 Sep 24;10:e64286. doi: 10.2196/64286.

引用本文的文献

1
Analysis of the epidemiological characteristics of pulmonary tuberculosis in Shijiazhuang, China 2010-2023.2010 - 2023年中国石家庄肺结核流行病学特征分析
Front Public Health. 2025 Jul 3;13:1621695. doi: 10.3389/fpubh.2025.1621695. eCollection 2025.
2
Epidemiological characteristics and spatiotemporal distribution of hepatitis C in southeast coastal areas of China from 2015 to 2022.2015年至2022年中国东南沿海地区丙型肝炎的流行病学特征及时空分布
BMC Infect Dis. 2025 Mar 21;25(1):394. doi: 10.1186/s12879-025-10778-w.
3
Analysis of epidemiological trends and risk factors in high-risk areas for pulmonary tuberculosis: an observational longitudinal study in Xinjiang, China.

本文引用的文献

1
[Spatio-temporal distribution of pulmonary tuberculosis and influencing factors in Beijing, 2008-2018].[2008 - 2018年北京市肺结核的时空分布及影响因素]
Zhonghua Liu Xing Bing Xue Za Zhi. 2021 Jul 10;42(7):1240-1245. doi: 10.3760/cma.j.cn112338-20210106-00008.
2
Spatial inequality, characteristics of internal migration, and pulmonary tuberculosis in China, 2011-2017: a spatial analysis.2011-2017 年中国的空间不平等、内部迁移特征与肺结核:空间分析。
Infect Dis Poverty. 2020 Nov 19;9(1):159. doi: 10.1186/s40249-020-00778-0.
3
Spatiotemporal Distribution of Tuberculosis and COVID-19 During the COVID-19 Pandemic in Libya.
肺结核高风险地区的流行病学趋势及危险因素分析:一项在中国新疆开展的纵向观察性研究
BMJ Open. 2025 Feb 7;15(2):e087413. doi: 10.1136/bmjopen-2024-087413.
4
Spatiotemporal Correlation Analysis for the Incidence of Esophageal and Gastric Cancer From 2010 to 2019: Ecological Study.2010年至2019年食管癌和胃癌发病率的时空相关性分析:生态学研究
JMIR Cancer. 2025 Jan 29;11:e66655. doi: 10.2196/66655.
5
Epidemiological Characteristics and Spatiotemporal Clustering of Pulmonary Tuberculosis Among Students in Southwest China From 2016 to 2022: Analysis of Population-Based Surveillance Data.2016 年至 2022 年中国西南地区学生人群肺结核的流行病学特征及时空聚集性分析:基于人群的监测数据分析。
JMIR Public Health Surveill. 2024 Sep 24;10:e64286. doi: 10.2196/64286.
6
Spatial and temporal analysis and forecasting of TB reported incidence in western China.中国西部地区结核病报告发病率的时空分析与预测。
BMC Public Health. 2024 Sep 13;24(1):2504. doi: 10.1186/s12889-024-19994-6.
7
Spatiotemporal analysis of tuberculosis in the Hunan Province, China, 2014-2022.2014-2022 年中国湖南省结核病的时空分析。
Front Public Health. 2024 Aug 8;12:1426503. doi: 10.3389/fpubh.2024.1426503. eCollection 2024.
8
Spatial-temporal distribution characteristics of pulmonary tuberculosis in eastern China from 2011 to 2021.2011 年至 2021 年中国东部地区肺结核的时空分布特征。
Epidemiol Infect. 2024 May 15;152:e84. doi: 10.1017/S0950268824000785.
9
Toward tuberculosis elimination by understanding epidemiologic characteristics and risk factors in Hainan Province, China.为实现海南省结核病消除目标,了解其流行病学特征和危险因素。
Infect Dis Poverty. 2024 Feb 27;13(1):20. doi: 10.1186/s40249-024-01188-2.
10
Predicting pulmonary tuberculosis incidence in China using Baidu search index: an ARIMAX model approach.利用百度搜索指数预测中国肺结核发病率:ARIMAX 模型方法。
Environ Health Prev Med. 2023;28:68. doi: 10.1265/ehpm.23-00141.
利比亚新冠疫情期间结核病和新冠肺炎的时空分布
Disaster Med Public Health Prep. 2021 Aug;15(4):e43-e45. doi: 10.1017/dmp.2020.458. Epub 2020 Nov 19.
4
The Spatiotemporal Dynamic Distributions of New Tuberculosis in Hangzhou, China.中国杭州新发结核病的时空动态分布
Biomed Environ Sci. 2020 Apr 20;33(4):277-281. doi: 10.3967/bes2020.038.