• 文献检索
  • 文档翻译
  • 深度研究
  • 学术资讯
  • Suppr Zotero 插件Zotero 插件
  • 邀请有礼
  • 套餐&价格
  • 历史记录
应用&插件
Suppr Zotero 插件Zotero 插件浏览器插件Mac 客户端Windows 客户端微信小程序
定价
高级版会员购买积分包购买API积分包
服务
文献检索文档翻译深度研究API 文档MCP 服务
关于我们
关于 Suppr公司介绍联系我们用户协议隐私条款
关注我们

Suppr 超能文献

核心技术专利:CN118964589B侵权必究
粤ICP备2023148730 号-1Suppr @ 2026

文献检索

告别复杂PubMed语法,用中文像聊天一样搜索,搜遍4000万医学文献。AI智能推荐,让科研检索更轻松。

立即免费搜索

文件翻译

保留排版,准确专业,支持PDF/Word/PPT等文件格式,支持 12+语言互译。

免费翻译文档

深度研究

AI帮你快速写综述,25分钟生成高质量综述,智能提取关键信息,辅助科研写作。

立即免费体验

本地和周边人为排放对中国河南郑州颗粒物污染事件的贡献。

Contribution of local and surrounding anthropogenic emissions to a particulate matter pollution episode in Zhengzhou, Henan, China.

机构信息

Key Laboratory of Geospatial Technology for the Middle and Lower Yellow River Regions, Ministry of Education, Henan University, Kaifeng, 475004, Henan, China.

Institute of Urban Big Data, College of Geography and Environmental Science, Henan University, Kaifeng, 475004, Henan, China.

出版信息

Sci Rep. 2023 May 30;13(1):8771. doi: 10.1038/s41598-023-35399-8.

DOI:10.1038/s41598-023-35399-8
PMID:37253757
原文链接:https://pmc.ncbi.nlm.nih.gov/articles/PMC10229599/
Abstract

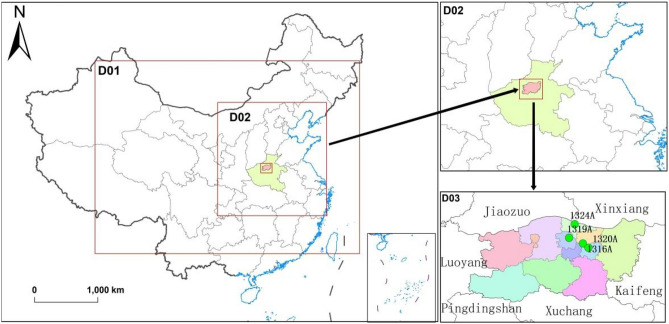
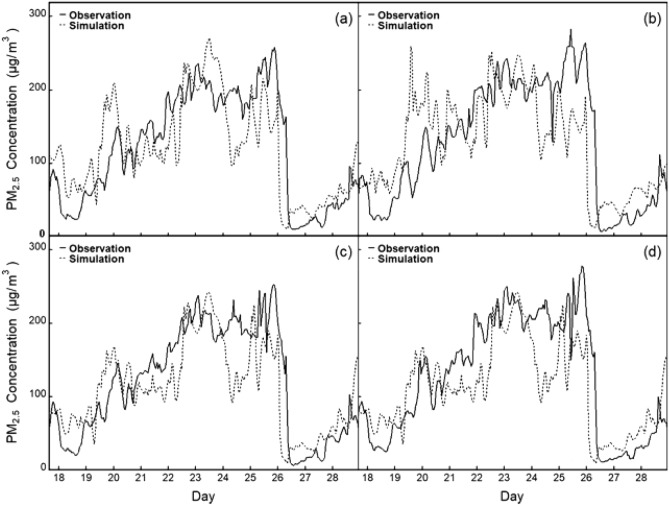
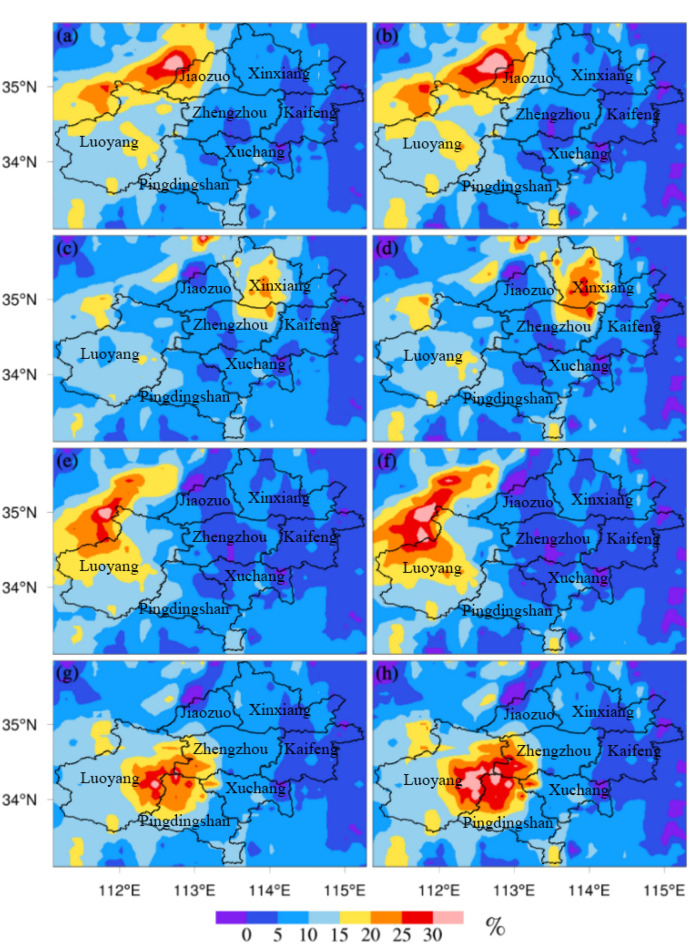
In this study, we simulated the spatial and temporal processes of a particulate matter (PM) pollution episode from December 10-29, 2019, in Zhengzhou, the provincial capital of Henan, China, which has a large population and severe PM pollution. As winter is the high incidence period of particulate pollution, winter statistical data were selected from the pollutant observation stations in the study area. During this period, the highest concentrations of PM (atmospheric PM with a diameter of less than 2.5 µm) and PM (atmospheric PM with a diameter of less than 10 µm) peaked at 283 μg m and 316 μg m, respectively. The contribution rates of local and surrounding regional emissions within Henan (emissions from the regions to the south, northwest, and northeast of Zhengzhou) to PM concentrations in Zhengzhou were quantitatively analyzed based on the regional Weather Research and Forecasting model coupled with Chemistry (WRF/Chem). Model evaluation showed that the WRF/Chem can accurately simulate the spatial and temporal variations in the PM concentrations in Zhengzhou. We found that the anthropogenic emissions south of Zhengzhou were the main causes of high PM concentrations during the studied episode, with contribution rates of 14.39% and 16.34% to PM and PM, respectively. The contributions of anthropogenic emissions from Zhengzhou to the PM and PM concentrations in Zhengzhou were 7.94% and 7.29%, respectively. The contributions of anthropogenic emissions from the area northeast of Zhengzhou to the PM and PM concentrations in Zhengzhou were 7.42% and 7.18%, respectively. These two areas had similar contributions to PM pollution in Zhengzhou. The area northeast of Zhengzhou had the lowest contributions to the PM and PM concentrations in Zhengzhou (5.96% and 5.40%, respectively).

摘要

在这项研究中,我们模拟了 2019 年 12 月 10 日至 29 日中国河南省省会郑州的一次颗粒物(PM)污染事件的时空过程,郑州人口众多,PM 污染严重。由于冬季是颗粒物污染高发期,因此选择了研究区域内污染物观测站的冬季统计数据。在此期间,PM(直径小于 2.5 µm 的大气颗粒物)和 PM(直径小于 10 µm 的大气颗粒物)的浓度最高值分别为 283 μg/m 和 316 μg/m。基于区域气象研究和预报模型与化学(WRF/Chem),定量分析了河南省内(郑州以南、西北和东北方向的区域排放)局地和周边区域排放对郑州 PM 浓度的贡献。模型评估表明,WRF/Chem 能够准确模拟郑州 PM 浓度的时空变化。我们发现,郑州南部的人为排放是该时段高 PM 浓度的主要原因,对 PM 和 PM 的贡献率分别为 14.39%和 16.34%。郑州人为排放对郑州 PM 和 PM 浓度的贡献率分别为 7.94%和 7.29%。郑州东北方向的人为排放对郑州 PM 和 PM 浓度的贡献率分别为 7.42%和 7.18%。这两个地区对郑州的 PM 污染有相似的贡献。郑州东北方向对郑州 PM 和 PM 浓度的贡献最低(分别为 5.96%和 5.40%)。

https://cdn.ncbi.nlm.nih.gov/pmc/blobs/8b0b/10229599/398a9315663c/41598_2023_35399_Fig11_HTML.jpg
https://cdn.ncbi.nlm.nih.gov/pmc/blobs/8b0b/10229599/a33ee63d21e1/41598_2023_35399_Fig1_HTML.jpg
https://cdn.ncbi.nlm.nih.gov/pmc/blobs/8b0b/10229599/5bbf986db43f/41598_2023_35399_Fig2_HTML.jpg
https://cdn.ncbi.nlm.nih.gov/pmc/blobs/8b0b/10229599/354efff0d14d/41598_2023_35399_Fig3_HTML.jpg
https://cdn.ncbi.nlm.nih.gov/pmc/blobs/8b0b/10229599/b71ca28a885e/41598_2023_35399_Fig4_HTML.jpg
https://cdn.ncbi.nlm.nih.gov/pmc/blobs/8b0b/10229599/863ca9bde383/41598_2023_35399_Fig5_HTML.jpg
https://cdn.ncbi.nlm.nih.gov/pmc/blobs/8b0b/10229599/62ed59e11ac4/41598_2023_35399_Fig6_HTML.jpg
https://cdn.ncbi.nlm.nih.gov/pmc/blobs/8b0b/10229599/9446a8c9e1f1/41598_2023_35399_Fig7_HTML.jpg
https://cdn.ncbi.nlm.nih.gov/pmc/blobs/8b0b/10229599/5ead1f0dbff5/41598_2023_35399_Fig8_HTML.jpg
https://cdn.ncbi.nlm.nih.gov/pmc/blobs/8b0b/10229599/4df5a2357656/41598_2023_35399_Fig9_HTML.jpg
https://cdn.ncbi.nlm.nih.gov/pmc/blobs/8b0b/10229599/88521a51c553/41598_2023_35399_Fig10_HTML.jpg
https://cdn.ncbi.nlm.nih.gov/pmc/blobs/8b0b/10229599/398a9315663c/41598_2023_35399_Fig11_HTML.jpg

相似文献

1
Contribution of local and surrounding anthropogenic emissions to a particulate matter pollution episode in Zhengzhou, Henan, China.本地和周边人为排放对中国河南郑州颗粒物污染事件的贡献。
Sci Rep. 2023 May 30;13(1):8771. doi: 10.1038/s41598-023-35399-8.
2
Contribution of local and surrounding area anthropogenic emissions to a high ozone episode in Zhengzhou, China.本地和周边地区人为排放物对中国郑州一次臭氧高值事件的贡献。
Environ Res. 2022 Sep;212(Pt C):113440. doi: 10.1016/j.envres.2022.113440. Epub 2022 May 6.
3
[One-year Simulation of Air Pollution in Central China, Characteristics, Distribution, Inner Region Cross-transmission, and Pathway Research in 18 Cities].[中国中部地区空气污染的一年模拟、18个城市的特征、分布、区域内交叉传输及路径研究]
Huan Jing Ke Xue. 2022 Aug 8;43(8):3953-3965. doi: 10.13227/j.hjkx.202111126.
4
Effect of agricultural soil wind erosion on urban PM concentrations simulated by WRF-Chem and WEPS: A case study in Kaifeng, China.农业土壤风蚀对 WRF-Chem 和 WEPS 模拟的城市 PM 浓度的影响:以中国开封为例。
Chemosphere. 2023 May;323:138250. doi: 10.1016/j.chemosphere.2023.138250. Epub 2023 Feb 25.
5
A seriously air pollution area affected by anthropogenic in the central China: temporal-spatial distribution and potential sources.受人为因素影响的中国中部严重空气污染区:时空分布与潜在源。
Environ Geochem Health. 2020 Oct;42(10):3199-3211. doi: 10.1007/s10653-020-00558-7. Epub 2020 Apr 18.
6
Spatial-temporal variation characteristics of air pollution in Henan of China: Localized emission inventory, WRF/Chem simulations and potential source contribution analysis.中国河南省大气污染的时空变化特征:本地化排放清单、WRF/Chem 模拟和潜在源贡献分析。
Sci Total Environ. 2018 May 15;624:396-406. doi: 10.1016/j.scitotenv.2017.12.102. Epub 2017 Dec 16.
7
Evaluation of regional transport of PM during severe atmospheric pollution episodes in the western Yangtze River Delta, China.中国长江三角洲西部地区严重大气污染期间 PM 的区域传输评估。
J Environ Manage. 2021 Sep 1;293:112827. doi: 10.1016/j.jenvman.2021.112827. Epub 2021 May 29.
8
[Seasonal Chemical Composition Characteristics and Source Apportionment of PM in Zhengzhou].[郑州PM的季节化学组成特征及源解析]
Huan Jing Ke Xue. 2020 Nov 8;41(11):4813-4824. doi: 10.13227/j.hjkx.202004099.
9
[Real-time Source Apportionment of PM and Potential Geographic Origins of Each Source During Winter in Wuhan].[武汉市冬季细颗粒物实时源解析及各源潜在地理来源]
Huan Jing Ke Xue. 2022 Jan 8;43(1):61-73. doi: 10.13227/j.hjkx.202105171.
10
The impact of the congestion charging scheme on air quality in London. Part 1. Emissions modeling and analysis of air pollution measurements.拥堵收费计划对伦敦空气质量的影响。第1部分。排放建模与空气污染测量分析。
Res Rep Health Eff Inst. 2011 Apr(155):5-71.

引用本文的文献

1
Spatiotemporal characteristic analysis of PM in central China and modeling of driving factors based on MGWR: a case study of Henan Province.基于 MGWR 的中国中部地区 PM 时空特征分析及驱动因素建模:以河南省为例。
Front Public Health. 2023 Dec 5;11:1295468. doi: 10.3389/fpubh.2023.1295468. eCollection 2023.

本文引用的文献

1
Source contribution analysis of PM using Response Surface Model and Particulate Source Apportionment Technology over the PRD region, China.基于响应面模型和颗粒物源解析技术对中国珠江三角洲地区 PM 的来源解析。
Sci Total Environ. 2022 Apr 20;818:151757. doi: 10.1016/j.scitotenv.2021.151757. Epub 2021 Nov 17.
2
Composition and sources of particulate matter in the Beijing-Tianjin-Hebei region and its surrounding areas during the heating season.采暖季京津冀及周边地区细颗粒物组成及其来源
Chemosphere. 2022 Mar;291(Pt 1):132779. doi: 10.1016/j.chemosphere.2021.132779. Epub 2021 Nov 3.
3
Estimating organic aerosol emissions from cooking in winter over the Pearl River Delta region, China.
估算中国珠江三角洲地区冬季烹饪产生的有机气溶胶排放。
Environ Pollut. 2022 Jan 1;292(Pt A):118266. doi: 10.1016/j.envpol.2021.118266. Epub 2021 Oct 2.
4
Local and transboundary transport contributions to the wintertime particulate pollution in the Guanzhong Basin (GZB), China: A case study.局地和跨区域传输对中国关中盆地冬季颗粒物污染的贡献:一项案例研究。
Sci Total Environ. 2021 Nov 25;797:148876. doi: 10.1016/j.scitotenv.2021.148876. Epub 2021 Jul 21.
5
Transboundary sources dominated PM in Thimphu, Bhutan.跨界来源主导了不丹廷布的细颗粒物。
Int J Environ Sci Technol (Tehran). 2022;19(6):5649-5658. doi: 10.1007/s13762-021-03505-w. Epub 2021 Jun 30.
6
Importance of regional PM transport and precipitation washout in heavy air pollution in the Twain-Hu Basin over Central China: Observational analysis and WRF-Chem simulation.中国中部二汉流域重霾期间区域 PM 输送和降水冲刷的重要性:观测分析和 WRF-Chem 模拟。
Sci Total Environ. 2021 Mar 1;758:143710. doi: 10.1016/j.scitotenv.2020.143710. Epub 2020 Nov 14.
7
Composition analysis of PM at multiple sites in Zhengzhou, China: implications for characterization and source apportionment at different pollution levels.中国郑州多个采样点的 PM 成分分析:不同污染水平下的特征描述和源解析的意义。
Environ Sci Pollut Res Int. 2021 Nov;28(42):59329-59344. doi: 10.1007/s11356-020-10943-5. Epub 2020 Oct 2.
8
Source apportionment of particulate matter based on numerical simulation during a severe pollution period in Tangshan, North China.基于数值模拟的华北唐山重污染期颗粒物来源解析。
Environ Pollut. 2020 Nov;266(Pt 3):115133. doi: 10.1016/j.envpol.2020.115133. Epub 2020 Jul 7.
9
Source and sectoral contribution analysis of PM based on efficient response surface modeling technique over Pearl River Delta Region of China.基于高效响应面建模技术的中国珠江三角洲地区细颗粒物源解析及部门贡献分析
Sci Total Environ. 2020 Oct 1;737:139655. doi: 10.1016/j.scitotenv.2020.139655. Epub 2020 May 26.
10
The moving of high emission for biomass burning in China: View from multi-year emission estimation and human-driven forces.中国生物质燃烧高排放物的迁移:基于多年排放估算和人为驱动因素的视角。
Environ Int. 2020 Sep;142:105812. doi: 10.1016/j.envint.2020.105812. Epub 2020 Jun 1.