• 文献检索
  • 文档翻译
  • 深度研究
  • 学术资讯
  • Suppr Zotero 插件Zotero 插件
  • 邀请有礼
  • 套餐&价格
  • 历史记录
应用&插件
Suppr Zotero 插件Zotero 插件浏览器插件Mac 客户端Windows 客户端微信小程序
定价
高级版会员购买积分包购买API积分包
服务
文献检索文档翻译深度研究API 文档MCP 服务
关于我们
关于 Suppr公司介绍联系我们用户协议隐私条款
关注我们

Suppr 超能文献

核心技术专利:CN118964589B侵权必究
粤ICP备2023148730 号-1Suppr @ 2026

文献检索

告别复杂PubMed语法,用中文像聊天一样搜索,搜遍4000万医学文献。AI智能推荐,让科研检索更轻松。

立即免费搜索

文件翻译

保留排版,准确专业,支持PDF/Word/PPT等文件格式,支持 12+语言互译。

免费翻译文档

深度研究

AI帮你快速写综述,25分钟生成高质量综述,智能提取关键信息,辅助科研写作。

立即免费体验

美国新冠疫情奥密克戎毒株浪潮的时空模式

Spatiotemporal Patterns of the Omicron Wave of COVID-19 in the United States.

作者信息

Zhang Siyuan, Liu Liran, Meng Qingxiang, Zhang Yixuan, Yang He, Xu Gang

机构信息

School of Resource and Environmental Sciences, Wuhan University, Wuhan 430079, China.

School of Remote Sensing and Information Engineering, Wuhan University, Wuhan 430079, China.

出版信息

Trop Med Infect Dis. 2023 Jun 30;8(7):349. doi: 10.3390/tropicalmed8070349.

DOI:10.3390/tropicalmed8070349
PMID:37505645
原文链接:https://pmc.ncbi.nlm.nih.gov/articles/PMC10385263/
Abstract

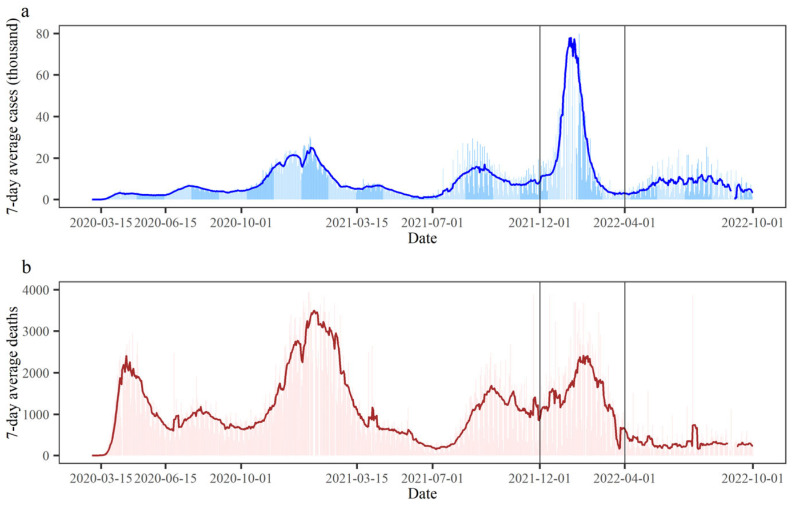
COVID-19 has undergone multiple mutations, with the Omicron variant proving to be highly contagious and rapidly spreading across many countries. The United States was severely hit by the Omicron variant. However, it was still unclear how Omicron transferred across the United States. Here, we collected daily COVID-19 cases and deaths in each county from 1 December 2021 to 28 February 2022 as the Omicron wave. We adopted space-time scan statistics, the Hoover index, and trajectories of the epicenter to quantify spatiotemporal patterns of the Omicron wave of COVID-19. The results showed that the highest and earliest cluster was located in the Northeast. The Hoover index for both cases and deaths exhibited phases of rapid decline, slow decline, and relative stability, indicating a rapid spread of the Omicron wave across the country. The Hoover index for deaths was consistently higher than that for cases. The epicenter of cases and deaths shifted from the west to the east, then southwest. Nevertheless, cases were more widespread than deaths, with a lag in mortality data. This study uncovers the spatiotemporal patterns of Omicron transmission in the United States, and its underlying mechanisms deserve further exploration.

摘要

新冠病毒已发生多次变异,事实证明,奥密克戎变异毒株具有高度传染性,并在许多国家迅速传播。美国受到奥密克戎变异毒株的严重冲击。然而,奥密克戎变异毒株在美国境内是如何传播的仍不清楚。在此,我们收集了2021年12月1日至2022年2月28日各县每日的新冠病例和死亡数据,作为奥密克戎毒株传播高峰期的数据。我们采用时空扫描统计法、胡佛指数以及疫情震中轨迹来量化新冠病毒奥密克戎毒株传播高峰期的时空模式。结果显示,最早出现的最高发聚集区位于美国东北部。病例和死亡人数的胡佛指数均呈现出快速下降、缓慢下降和相对稳定的阶段,这表明奥密克戎毒株传播高峰期在全国范围内迅速蔓延。死亡人数的胡佛指数始终高于病例数的胡佛指数。病例和死亡的震中从西部转移到东部,然后又转移到西南部。尽管如此,病例的分布范围比死亡人数更广,死亡数据存在滞后性。本研究揭示了奥密克戎毒株在美国传播的时空模式,其潜在机制值得进一步探索。

https://cdn.ncbi.nlm.nih.gov/pmc/blobs/7dd3/10385263/a33a87c2eb49/tropicalmed-08-00349-g005.jpg
https://cdn.ncbi.nlm.nih.gov/pmc/blobs/7dd3/10385263/6650b7101bfd/tropicalmed-08-00349-g001.jpg
https://cdn.ncbi.nlm.nih.gov/pmc/blobs/7dd3/10385263/717679ea9ce6/tropicalmed-08-00349-g002.jpg
https://cdn.ncbi.nlm.nih.gov/pmc/blobs/7dd3/10385263/29d3cbe55c72/tropicalmed-08-00349-g003.jpg
https://cdn.ncbi.nlm.nih.gov/pmc/blobs/7dd3/10385263/eca0103969c0/tropicalmed-08-00349-g004.jpg
https://cdn.ncbi.nlm.nih.gov/pmc/blobs/7dd3/10385263/a33a87c2eb49/tropicalmed-08-00349-g005.jpg

相似文献

1
Spatiotemporal Patterns of the Omicron Wave of COVID-19 in the United States.美国新冠疫情奥密克戎毒株浪潮的时空模式
Trop Med Infect Dis. 2023 Jun 30;8(7):349. doi: 10.3390/tropicalmed8070349.
2
Trends in Disease Severity and Health Care Utilization During the Early Omicron Variant Period Compared with Previous SARS-CoV-2 High Transmission Periods - United States, December 2020-January 2022.疾病严重程度和医疗保健利用趋势在奥密克戎变异株早期与之前 SARS-CoV-2 高传播期相比-美国,2020 年 12 月至 2022 年 1 月。
MMWR Morb Mortal Wkly Rep. 2022 Jan 28;71(4):146-152. doi: 10.15585/mmwr.mm7104e4.
3
Spatiotemporal analysis of the morbidity of global Omicron from November 2021 to February 2022.2021 年 11 月至 2022 年 2 月期间全球奥密克戎发病率的时空分析。
J Med Virol. 2022 Nov;94(11):5354-5362. doi: 10.1002/jmv.28013. Epub 2022 Jul 29.
4
Critical national response in coping with Omicron variant in China, Israel, South Africa, and the United States.中国、以色列、南非和美国应对奥密克戎变异株的国家关键反应。
Front Public Health. 2023 Jun 9;11:1157824. doi: 10.3389/fpubh.2023.1157824. eCollection 2023.
5
Global spreading of Omicron variant of COVID-19.新冠病毒奥密克戎变异株的全球传播。
Geospat Health. 2022 Jul 13;17(s1). doi: 10.4081/gh.2022.1083.
6
Decreased severity of disease during the first global omicron variant covid-19 outbreak in a large hospital in tshwane, south africa.南非茨瓦尼一家大医院首次全球奥密克戎变异株 COVID-19 疫情期间疾病严重程度降低。
Int J Infect Dis. 2022 Mar;116:38-42. doi: 10.1016/j.ijid.2021.12.357. Epub 2021 Dec 28.
7
Retrospective Observational Study of Complete Blood Count (CBC) Parameters and ICU Mortality of COVID-19 Disease in Delta Variant and Omicron Variant in a Community-Based Hospital in New York City.纽约市一家社区医院中关于新冠病毒德尔塔变异株和奥密克戎变异株的全血细胞计数(CBC)参数与ICU死亡率的回顾性观察研究
Cureus. 2023 Feb 12;15(2):e34894. doi: 10.7759/cureus.34894. eCollection 2023 Feb.
8
Clinical Characteristics and Risk Factors for Mortality in Critical COVID-19 Patients Aged 50 Years or Younger During Omicron Wave in Korea: Comparison With Patients Older Than 50 Years of Age.韩国奥密克戎变异株流行期间 50 岁及以下危重症 COVID-19 患者的临床特征及死亡危险因素:与 50 岁以上患者的比较。
J Korean Med Sci. 2023 Jul 17;38(28):e217. doi: 10.3346/jkms.2023.38.e217.
9
SARS-CoV-2 B.1.1.529 (Omicron) Variant - United States, December 1-8, 2021.SARS-CoV-2 B.1.1.529(奥密克戎)变异株-美国,2021 年 12 月 1 日-8 日。
MMWR Morb Mortal Wkly Rep. 2021 Dec 17;70(50):1731-1734. doi: 10.15585/mmwr.mm7050e1.
10
Tracking and controlling the spatiotemporal spread of SARS-CoV-2 Omicron variant in South Africa.追踪和控制 SARS-CoV-2 奥密克戎变异株在南非的时空传播。
Travel Med Infect Dis. 2022 Mar-Apr;46:102252. doi: 10.1016/j.tmaid.2021.102252. Epub 2021 Dec 30.

引用本文的文献

1
Patterns and Predictors of COVID-19 Vaccine Uptake Among U.S. Active Duty Service Members, 2020-2022: Implications for Future Pandemics.2020 - 2022年美国现役军人中新冠病毒疫苗接种模式及预测因素:对未来大流行的启示
Mil Med. 2025 Apr 23;190(5-6):1243-1252. doi: 10.1093/milmed/usaf004.

本文引用的文献

1
Spatial Analysis of Dengue Clusters at Department, Municipality and Local Scales in the Southwest of Colombia, 2014-2019.2014 - 2019年哥伦比亚西南部登革热聚集性病例在部门、市和地方层面的空间分析
Trop Med Infect Dis. 2023 May 2;8(5):262. doi: 10.3390/tropicalmed8050262.
2
Measuring social resilience in cities: An exploratory spatio-temporal analysis of activity routines in urban spaces during Covid-19.衡量城市的社会复原力:对新冠疫情期间城市空间活动规律的探索性时空分析
Cities. 2023 Apr;135:104220. doi: 10.1016/j.cities.2023.104220. Epub 2023 Feb 1.
3
The WHO estimates of excess mortality associated with the COVID-19 pandemic.
世界卫生组织对 COVID-19 大流行相关超额死亡人数的估计。
Nature. 2023 Jan;613(7942):130-137. doi: 10.1038/s41586-022-05522-2. Epub 2022 Dec 14.
4
Analysis of distribution characteristics of COVID-19 in America based on space-time scan statistic.基于时空扫描统计的美国 COVID-19 分布特征分析。
Front Public Health. 2022 Aug 10;10:897784. doi: 10.3389/fpubh.2022.897784. eCollection 2022.
5
Spatiotemporal analysis of the morbidity of global Omicron from November 2021 to February 2022.2021 年 11 月至 2022 年 2 月期间全球奥密克戎发病率的时空分析。
J Med Virol. 2022 Nov;94(11):5354-5362. doi: 10.1002/jmv.28013. Epub 2022 Jul 29.
6
Spatial growth rate of emerging SARS-CoV-2 lineages in England, September 2020-December 2021.2020 年 9 月至 2021 年 12 月期间英国出现的 SARS-CoV-2 谱系的空间增长率。
Epidemiol Infect. 2022 Jul 20;150:e145. doi: 10.1017/S0950268822001285.
7
Global spreading of Omicron variant of COVID-19.新冠病毒奥密克戎变异株的全球传播。
Geospat Health. 2022 Jul 13;17(s1). doi: 10.4081/gh.2022.1083.
8
Serial Intervals for SARS-CoV-2 Omicron and Delta Variants, Belgium, November 19-December 31, 2021.2021 年 11 月 19 日至 12 月 31 日,比利时奥密克戎和德尔塔变异株的连续间隔时间。
Emerg Infect Dis. 2022 Aug;28(8):1699-1702. doi: 10.3201/eid2808.220220. Epub 2022 Jun 22.
9
Lockdown induced night-time light dynamics during the COVID-19 epidemic in global megacities.新冠疫情期间全球特大城市因封锁导致的夜间灯光动态变化
Int J Appl Earth Obs Geoinf. 2021 Oct;102:102421. doi: 10.1016/j.jag.2021.102421. Epub 2021 Jun 30.
10
The Geographical Distribution and Influencing Factors of COVID-19 in China.中国新冠肺炎的地理分布及影响因素
Trop Med Infect Dis. 2022 Mar 6;7(3):45. doi: 10.3390/tropicalmed7030045.