Department of General Internal Medicine, School of Medicine, Hyogo Medical University, Nishinomiya, Japan.
Roppou Clinic, Toyooka, Hyogo, Japan.
Clin Interv Aging. 2023 Jul 28;18:1191-1200. doi: 10.2147/CIA.S413513. eCollection 2023.
This study aimed to evaluate the relationship between timed up-and-go (TUG) test time and changes in frailty status in a longitudinal cohort study of rural Japanese older adults.
This prospective cohort study included 545 community-dwelling older adults. Initial and 2-year follow-up surveys were conducted. We compared the number of the Japanese version of the Cardiovascular Health Study components during the follow-up period and classified the participants into three groups: the favorable change, unchanged as prefrail, and unfavorable change groups. Associations between changes in frailty status and TUG time in the first survey were examined. The predictive ability of the TUG test was determined using the receiver operating characteristic (ROC) curve.
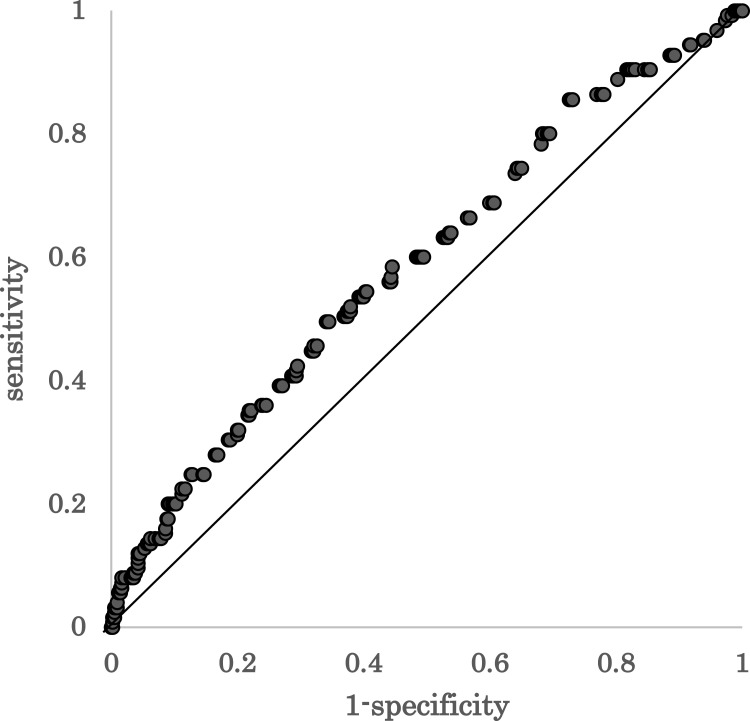
The favorable change group comprised 315 individuals (57.8%), the unchanged as prefrail group 105 (19.2%), and the unfavorable change group 125 (22.9%). TUG time was associated with the favorable and unfavorable changes after adjustment for covariates (OR 0.79, 95% CI 0.68-0.92, =0.001 and OR 1.27, 95% CI 1.09-1.49, =0.002). The ROC curve of TUG time as a predictor of unfavorable changes showed an area under the curve of 0.59. A cut-off point of TUG was calculated as 6.3 s with 49.6% sensitivity and 66.0% specificity.
TUG time in the first survey was significantly associated with changes in frailty status 2 years later. However, its predictive value as a stand-alone test is limited and has the potential to predict future changes in the frailty status in older adults in combination with other tests.
本研究旨在评估日本农村老年人纵向队列研究中计时起立行走(TUG)测试时间与虚弱状态变化之间的关系。
本前瞻性队列研究纳入了 545 名居住在社区的老年人。进行了初始和 2 年随访调查。我们比较了随访期间日本心血管健康研究(J-CHS)各项的数量,并将参与者分为三组:有利变化组、虚弱前期不变组和不利变化组。分析了第一调查中虚弱状态变化与 TUG 时间之间的关系。使用受试者工作特征(ROC)曲线确定 TUG 测试的预测能力。
有利变化组包括 315 人(57.8%),虚弱前期不变组 105 人(19.2%),不利变化组 125 人(22.9%)。在调整协变量后,TUG 时间与有利和不利变化相关(OR 0.79,95%CI 0.68-0.92,=0.001 和 OR 1.27,95%CI 1.09-1.49,=0.002)。TUG 时间作为不利变化预测因子的 ROC 曲线下面积为 0.59。TUG 的截断点计算为 6.3 秒,具有 49.6%的敏感性和 66.0%的特异性。
第一调查中的 TUG 时间与 2 年后的虚弱状态变化显著相关。然而,其作为独立测试的预测价值有限,与其他测试结合使用可能有助于预测老年人未来的虚弱状态变化。