Zhao Bo, Huepenbecker Sarah, Zhu Gen, Rajan Suja S, Fujimoto Kayo, Luo Xi
Department of Biostatistics and Data Science, School of Public Health, The University of Texas Health Science Center, Houston, TX, United States.
Department of Gynecologic Oncology and Reproductive Medicine, The University of Texas MD Anderson Cancer Center, Houston, TX, United States.
Front Big Data. 2023 Aug 17;6:846202. doi: 10.3389/fdata.2023.846202. eCollection 2023.
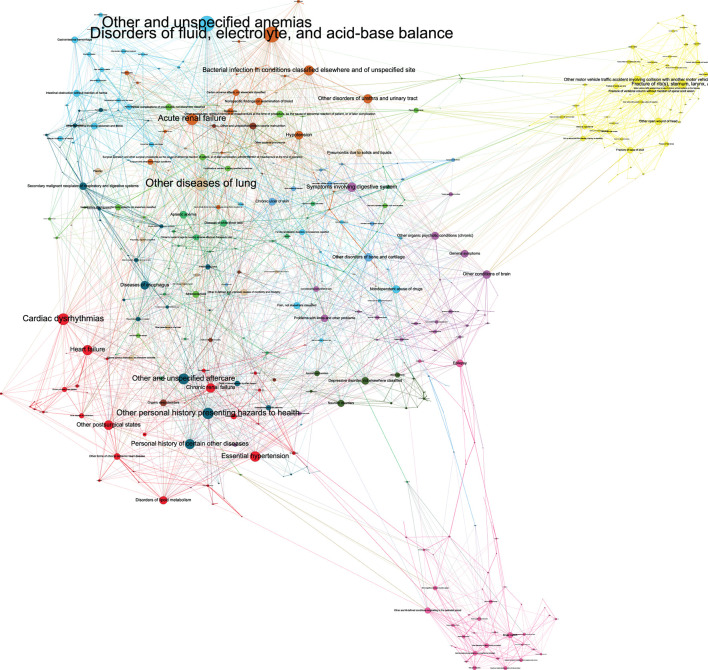
The comorbidity network represents multiple diseases and their relationships in a graph. Understanding comorbidity networks among critical care unit (CCU) patients can help doctors diagnose patients faster, minimize missed diagnoses, and potentially decrease morbidity and mortality.
The main objective of this study was to identify the comorbidity network among CCU patients using a novel application of a machine learning method (graphical modeling method). The second objective was to compare the machine learning method with a traditional pairwise method in simulation.
This cross-sectional study used CCU patients' data from Medical Information Mart for the Intensive Care-3 (MIMIC-3) dataset, an electronic health record (EHR) of patients with CCU hospitalizations within Beth Israel Deaconess Hospital from 2001 to 2012. A machine learning method (graphical modeling method) was applied to identify the comorbidity network of 654 diagnosis categories among 46,511 patients.
Out of the 654 diagnosis categories, the graphical modeling method identified a comorbidity network of 2,806 associations in 510 diagnosis categories. Two medical professionals reviewed the comorbidity network and confirmed that the associations were consistent with current medical understanding. Moreover, the strongest association in our network was between "poisoning by psychotropic agents" and "accidental poisoning by tranquilizers" (logOR 8.16), and the most connected diagnosis was "disorders of fluid, electrolyte, and acid-base balance" (63 associated diagnosis categories). Our method outperformed traditional pairwise comorbidity network methods in simulation studies. Some strongest associations between diagnosis categories were also identified, for example, "diagnoses of mitral and aortic valve" and "other rheumatic heart disease" (logOR: 5.15). Furthermore, our method identified diagnosis categories that were connected with most other diagnosis categories, for example, "disorders of fluid, electrolyte, and acid-base balance" was associated with 63 other diagnosis categories. Additionally, using a data-driven approach, our method partitioned the diagnosis categories into 14 modularity classes.
Our graphical modeling method inferred a logical comorbidity network whose associations were consistent with current medical understanding and outperformed traditional network methods in simulation. Our comorbidity network method can potentially assist CCU doctors in diagnosing patients faster and minimizing missed diagnoses.
共病网络以图形方式呈现多种疾病及其关系。了解重症监护病房(CCU)患者的共病网络有助于医生更快地诊断患者,减少漏诊,并有可能降低发病率和死亡率。
本研究的主要目的是使用一种机器学习方法(图形建模方法)的新应用来识别CCU患者中的共病网络。第二个目的是在模拟中比较机器学习方法与传统的成对方法。
这项横断面研究使用了重症监护医学信息集市-3(MIMIC-3)数据集中CCU患者的数据,这是贝斯以色列女执事医疗中心2001年至2012年期间CCU住院患者的电子健康记录(EHR)。应用一种机器学习方法(图形建模方法)来识别46511名患者中654个诊断类别的共病网络。
在654个诊断类别中,图形建模方法在510个诊断类别中识别出了一个包含2806个关联的共病网络。两名医学专业人员对该共病网络进行了审查,并确认这些关联与当前医学认知一致。此外,我们网络中最强的关联是“精神药物中毒”和“镇静剂意外中毒”之间(对数比值比8.16),连接最多的诊断是“液体、电解质和酸碱平衡紊乱”(63个相关诊断类别)。在模拟研究中,我们的方法优于传统的成对共病网络方法。还识别出了一些诊断类别之间最强的关联,例如,“二尖瓣和主动脉瓣诊断”与“其他风湿性心脏病”(对数比值比:5.15)。此外,我们的方法识别出了与大多数其他诊断类别相关的诊断类别,例如,“液体、电解质和酸碱平衡紊乱”与63个其他诊断类别相关。此外,通过数据驱动的方法,我们的方法将诊断类别划分为14个模块类。
我们的图形建模方法推断出一个逻辑共病网络,其关联与当前医学认知一致,并且在模拟中优于传统网络方法。我们的共病网络方法有可能帮助CCU医生更快地诊断患者并减少漏诊。