Life Sciences, PepsiCo R&D, Reading RG2 6UW, UK.
Life Sciences, PepsiCo R&D, Purchase, NY 10577, USA.
Nutrients. 2023 Nov 15;15(22):4784. doi: 10.3390/nu15224784.
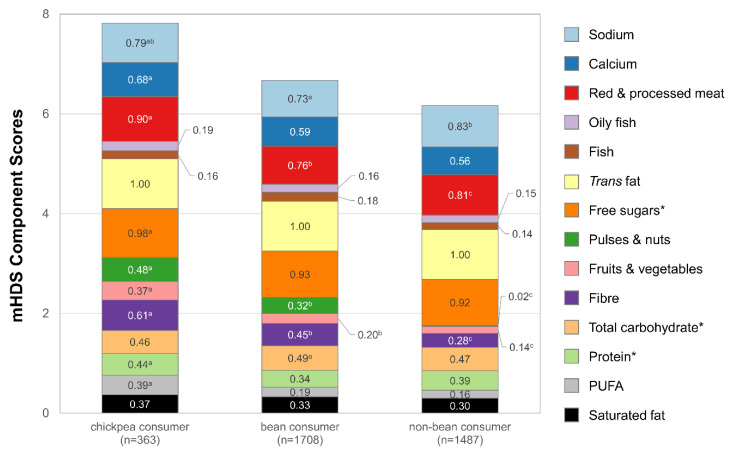
Only 9% of individuals in the United Kingdom (UK) meet the recommendation for dietary fibre intake. Little is known about chickpea consumption in the UK. Chickpea intake trends and sociodemographic patterns were analysed using the National Diet and Nutrition Survey Rolling Programme data collected from 2008/09 to 2018/19 among 15,655 individuals ≥1.5 years completing a four-day food diary. Chickpea consumers were identified based on a list of chickpea-containing foods, with the most consumed foods being hummus, boiled chickpeas, chickpea flour, and low/reduced-fat hummus. Micronutrient and food group intakes were compared between chickpea consumers and non-consumers; the Modified Healthy Dietary Score was also assessed, which measures adherence to UK dietary recommendations. Chickpea consumption increased from 6.1% (2008-2012) to 12.3% (2016-2019). Among 1.5-3 years, consumption increased from 5.7% to 13.4%, and among 19-64 years, consumption increased from 7.1% to 14.4%. The percentage of individuals eating chickpeas was higher among individuals with higher incomes and more education. Healthy-weight adults were more likely to consume chickpeas compared to those who were overweight or obese. Compared to both bean and non-bean consumers, chickpea consumers ate significantly more dietary fibre, fruits and vegetables, pulses, nuts, and less red meat and processed meat products. Chickpea consumers also had a higher Modified Healthy Dietary Score. In the UK, chickpea consumption more than doubled from 2008/09 to 2018/19. Chickpea consumers had a higher diet quality than non-consumers.
仅有 9%的英国(UK)人达到膳食纤维的推荐摄入量。对于英国的鹰嘴豆消费情况知之甚少。本研究使用 2008/09 年至 2018/19 年期间通过国家饮食与营养调查滚动计划收集的数据,分析了英国的鹰嘴豆摄入趋势和社会人口统计学模式,该调查共纳入 15655 名年龄≥1.5 岁并完成四天食物日记的个体。基于含有鹰嘴豆食物的清单来确定鹰嘴豆消费者,最常食用的食物是鹰嘴豆泥、煮鹰嘴豆、鹰嘴豆粉和低脂/减脂鹰嘴豆泥。比较了鹰嘴豆消费者和非消费者的微量营养素和食物组摄入量;还评估了改良健康饮食评分,用于衡量对英国饮食建议的依从性。鹰嘴豆消费从 6.1%(2008-2012 年)增加到 12.3%(2016-2019 年)。在 1.5-3 岁组中,消费从 5.7%增加到 13.4%,在 19-64 岁组中,消费从 7.1%增加到 14.4%。收入较高和受教育程度较高的个体中食用鹰嘴豆的比例更高。与超重或肥胖者相比,健康体重的成年人更有可能食用鹰嘴豆。与豆类和非豆类消费者相比,鹰嘴豆消费者摄入了更多的膳食纤维、水果和蔬菜、豆类、坚果,以及更少的红肉和加工肉类产品。鹰嘴豆消费者的改良健康饮食评分也更高。在英国,从 2008/09 年到 2018/19 年,鹰嘴豆消费增加了一倍多。与非消费者相比,鹰嘴豆消费者的饮食质量更高。