Drewnowski Adam, Zavela Catherine, Tran Vanessa, Mallya Greeshma, Conrad Zach
Center for Public Health Nutrition, University of Washington, Seattle, WA, United States.
Food Systems, Nutrition and Health Program, School of Public Health, University of Washington, Seattle, WA, United States.
Front Nutr. 2025 Aug 21;12:1638519. doi: 10.3389/fnut.2025.1638519. eCollection 2025.
The 2025-30 US Dietary Guidelines Advisory Committee has recommended moving pulses to the Protein Foods Group and listing them ahead of meat, poultry, and eggs. The recommended amounts went up from 1.5 to 2.5 cups/week per 2,000 kcal daily.
To track temporal trends in pulse consumption in the US from 1999 to 2018 by consumer socio-demographics and by pulse type.
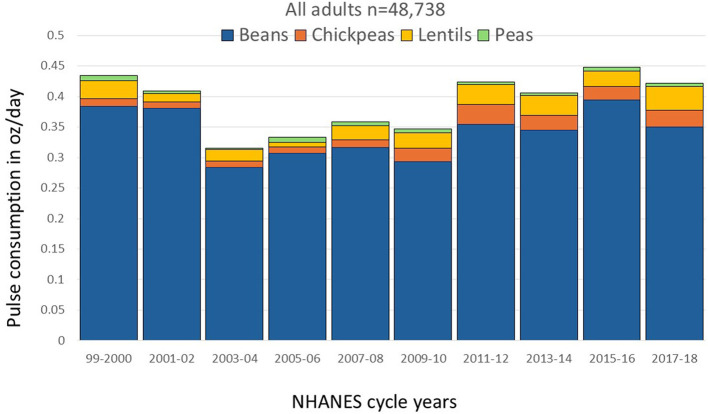
Dietary intakes data came from 10 cycles of the National Health and Nutrition Examination Survey (NHANES 1999-2018). Adult participants were stratified by sex, age group, income to poverty ratio (IPR), education, and race/ethnicity Pulses were separated into beans, chickpeas, peas, and lentils. Analyses were conducted for the whole sample ( = 48,738) and for pulse consumers ( = 9,186). Trend analyses were based on linear regression models.
Across all years tested, only 17.2% of NHANES participants consumed any pulses on a given day. Mean prevalence was highest among Mexican Americans (33.3%) and lowest among non-Hispanic Black groups (12.0%). Consumption prevalence dropped after 1999-2000 but recovered after 2007-08. Mean consumption of cooked pulses was 0.39 oz/day overall and 2.26 oz/day among consumers. Higher amounts were consumed by Mexican Americans, men, and groups with lower education and incomes. In 2017-2018, 19.9% of the population consumed 1.5 cups/week of cooked pulses and 10.9% consumed 2.5 cups/week. Beans were the most consumed pulse followed by lentils, chickpeas, and peas. Unlike beans, both lentils and chickpeas were associated with higher socioeconomic status.
Other than among Mexican Americans, pulse consumption in the US was low and was associated with lower education and incomes. However, pulse consumers consumed substantial amounts. Lentils and chickpeas may represent opportunities for increasing pulse consumption. The present findings are relevant to the implementation of the 2025-30 Dietary Guidelines for Americans and can help target the promotion of pulses among population subgroups.
2025 - 2030年美国膳食指南咨询委员会建议将豆类食品归入蛋白质类食物组,并将其排在肉类、禽类和蛋类之前。建议的食用量从每日2000千卡热量对应的每周1.5杯增加到2.5杯。
按消费者社会人口统计学特征和豆类品种追踪1999年至2018年美国豆类消费的时间趋势。
膳食摄入数据来自10轮国家健康与营养检查调查(1999 - 2018年的NHANES)。成年参与者按性别、年龄组、收入与贫困比(IPR)、教育程度和种族/族裔进行分层。豆类分为豆类、鹰嘴豆、豌豆和小扁豆。对整个样本(n = 48,738)和豆类消费者(n = 9,186)进行了分析。趋势分析基于线性回归模型。
在所有测试年份中,NHANES参与者中只有17.2%在某一天食用了任何豆类。平均患病率在墨西哥裔美国人中最高(33.3%),在非西班牙裔黑人组中最低(12.0%)。1999 - 2000年后消费患病率下降,但在2007 - 2008年后有所回升。煮熟豆类的平均消费量总体为每天0.39盎司,消费者中为每天2.26盎司。墨西哥裔美国人、男性以及教育程度和收入较低的群体食用量更高。在2017 - 2018年,19.9%的人口每周食用1.5杯煮熟的豆类,10.9%的人口每周食用2.5杯。豆类是食用最多的豆类品种,其次是小扁豆、鹰嘴豆和豌豆。与豆类不同,小扁豆和鹰嘴豆都与较高的社会经济地位相关。
除墨西哥裔美国人外,美国的豆类消费量较低,且与较低的教育程度和收入相关。然而,豆类消费者的食用量很大。小扁豆和鹰嘴豆可能是增加豆类消费的机会。本研究结果与《2025 - 2030年美国人膳食指南》的实施相关,有助于针对不同人群亚组推广豆类食品。