• 文献检索
  • 文档翻译
  • 深度研究
  • 学术资讯
  • Suppr Zotero 插件Zotero 插件
  • 邀请有礼
  • 套餐&价格
  • 历史记录
应用&插件
Suppr Zotero 插件Zotero 插件浏览器插件Mac 客户端Windows 客户端微信小程序
定价
高级版会员购买积分包购买API积分包
服务
文献检索文档翻译深度研究API 文档MCP 服务
关于我们
关于 Suppr公司介绍联系我们用户协议隐私条款
关注我们

Suppr 超能文献

核心技术专利:CN118964589B侵权必究
粤ICP备2023148730 号-1Suppr @ 2026

文献检索

告别复杂PubMed语法,用中文像聊天一样搜索,搜遍4000万医学文献。AI智能推荐,让科研检索更轻松。

立即免费搜索

文件翻译

保留排版,准确专业,支持PDF/Word/PPT等文件格式,支持 12+语言互译。

免费翻译文档

深度研究

AI帮你快速写综述,25分钟生成高质量综述,智能提取关键信息,辅助科研写作。

立即免费体验

利用延时电阻层析成像技术对尾矿含水量预测进行的多尺度精度评估。

A multiscale accuracy assessment of moisture content predictions using time-lapse electrical resistivity tomography in mine tailings.

作者信息

Dimech Adrien, Isabelle Anne, Sylvain Karine, Liu Chong, Cheng LiZhen, Bussière Bruno, Chouteau Michel, Fabien-Ouellet Gabriel, Bérubé Charles, Wilkinson Paul, Meldrum Philip, Chambers Jonathan

机构信息

Université du Québec en Abitibi-Témiscamingue (UQAT), Rouyn Noranda, QC, J9X 5E4, Canada.

Research Institute of Mines and Environment (RIME), Montréal, QC, Canada.

出版信息

Sci Rep. 2023 Nov 27;13(1):20922. doi: 10.1038/s41598-023-48100-w.

DOI:10.1038/s41598-023-48100-w
PMID:38017002
原文链接:https://pmc.ncbi.nlm.nih.gov/articles/PMC10684595/
Abstract

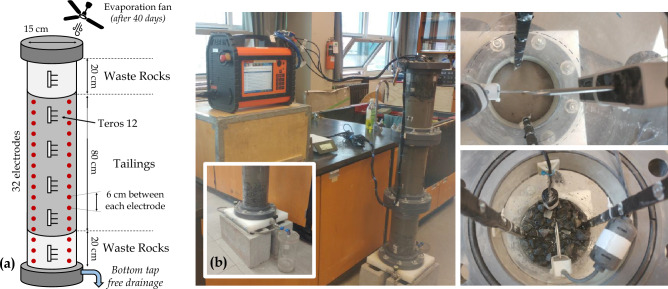
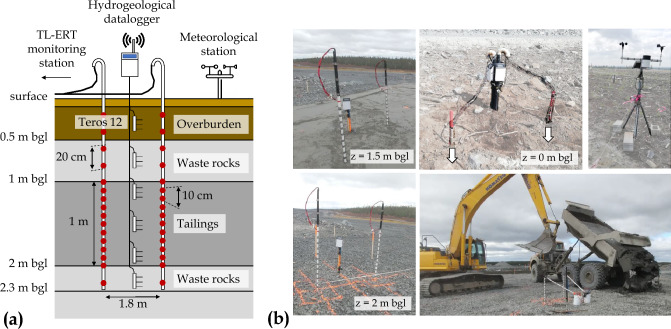
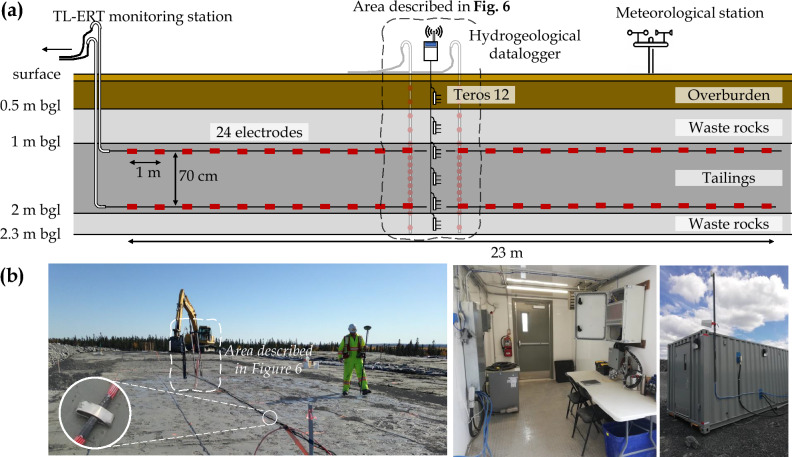
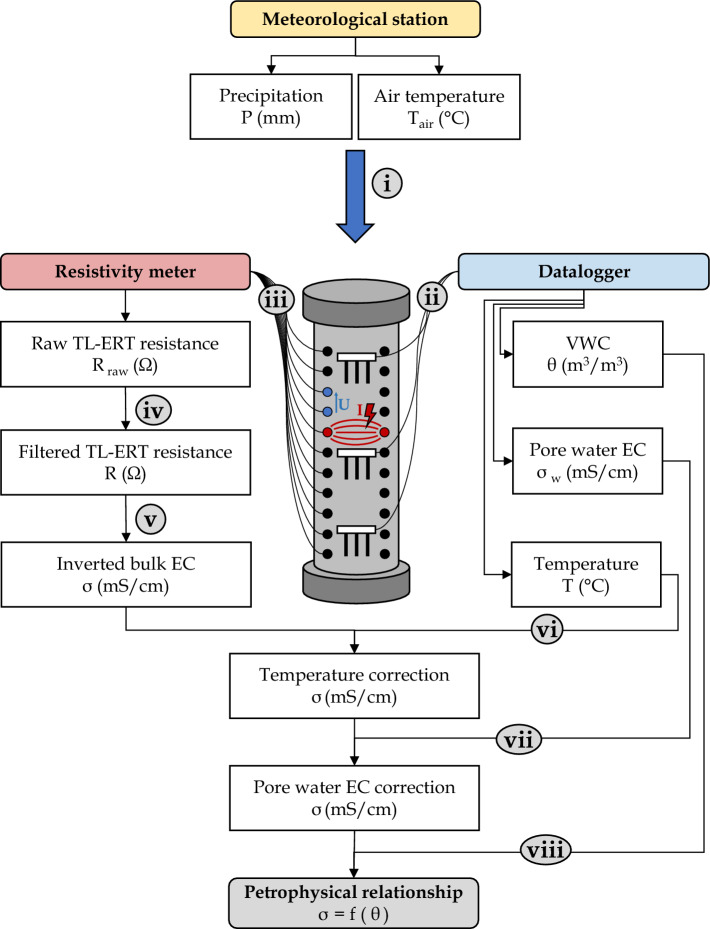
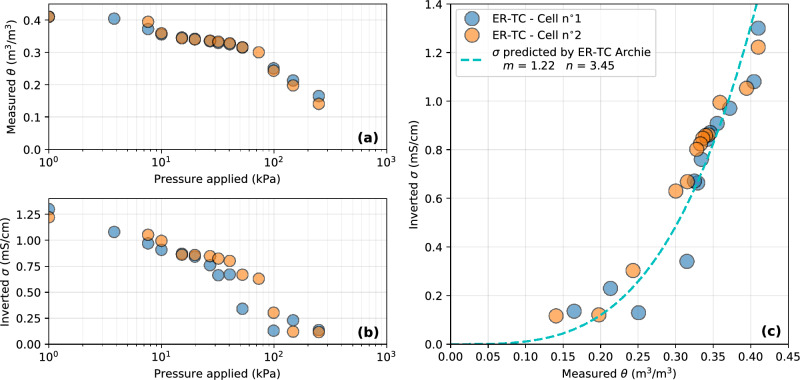
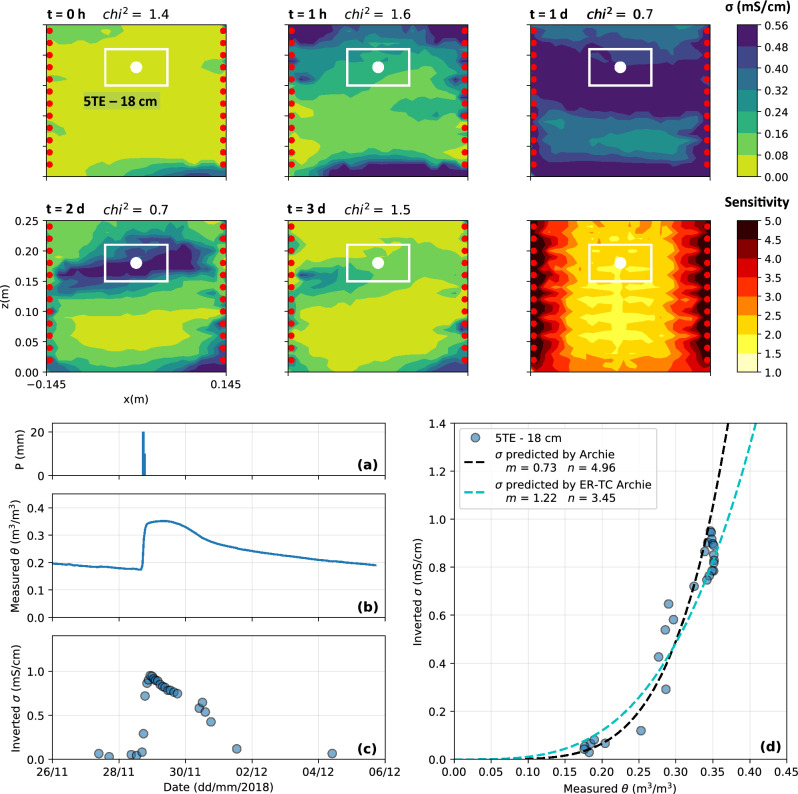
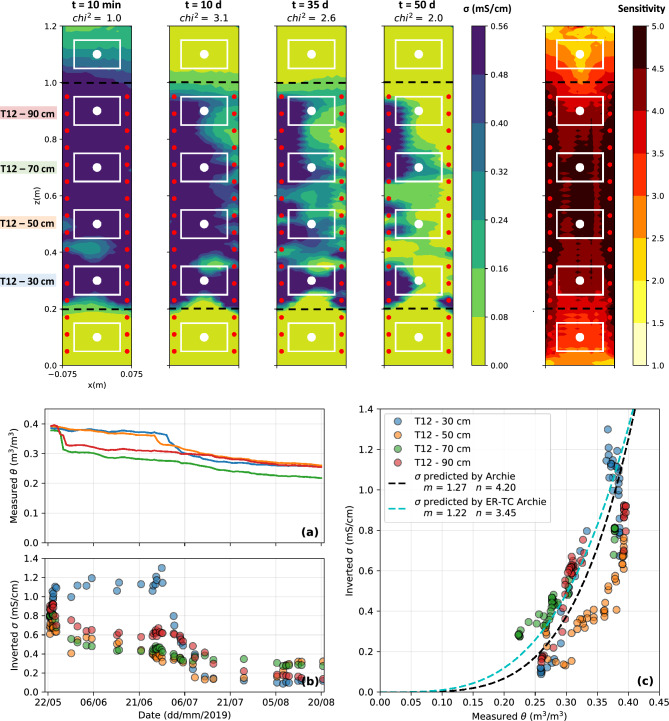
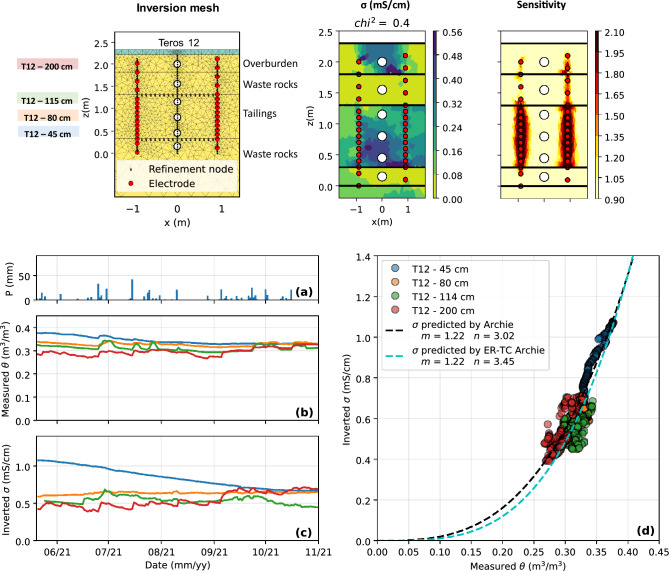
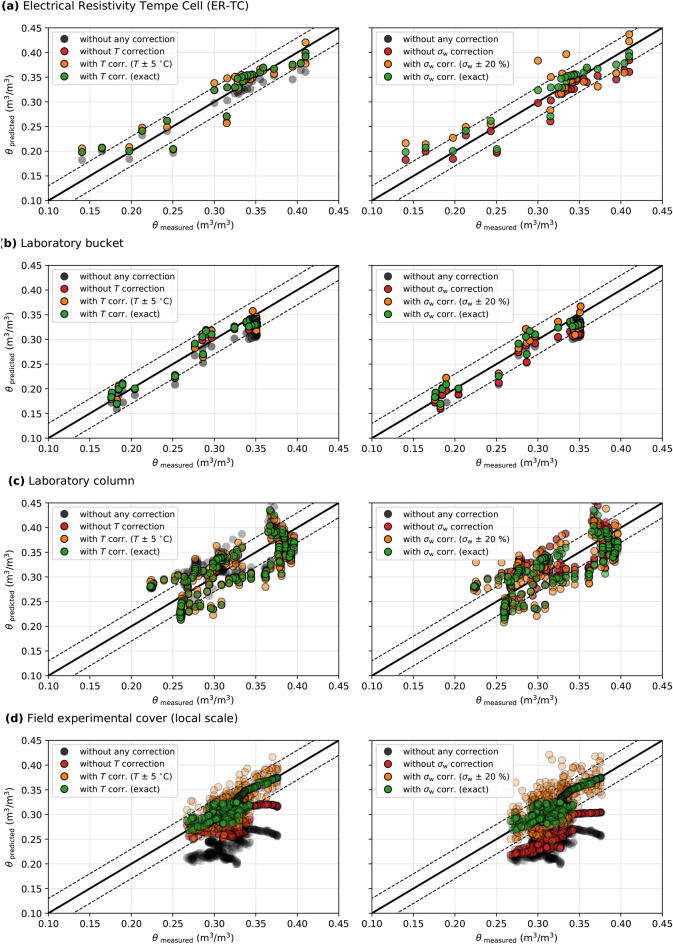
Accurate and large-scale assessment of volumetric water content (VWC) plays a critical role in mining waste monitoring to mitigate potential geotechnical and environmental risks. In recent years, time-lapse electrical resistivity tomography (TL-ERT) has emerged as a promising monitoring approach that can be used in combination with traditional invasive and point-measurements techniques to estimate VWC in mine tailings. Moreover, the bulk electrical conductivity (EC) imaged using TL-ERT can be converted into VWC in the field using petrophysical relationships calibrated in the laboratory. This study is the first to assess the scale effect on the accuracy of ERT-predicted VWC in tailings. Simultaneous and co-located monitoring of bulk EC and VWC are carried out in tailings at five different scales, in the laboratory and in the field. The hydrogeophysical datasets are used to calibrate a petrophysical model used to predict VWC from TL-ERT data. Overall, the accuracy of ERT-predicted VWC is [Formula: see text], and the petrophysical models determined at sample-scale in the laboratory remain valid at larger scales. Notably, the impact of temperature and pore water EC evolution plays a major role in VWC predictions at the field scale (tenfold reduction of accuracy) and, therefore, must be properly taken into account during the TL-ERT data processing using complementary hydrogeological sensors. Based on these results, we suggest that future studies using TL-ERT to predict VWC in mine tailings could use sample-scale laboratory apparatus similar to the electrical resistivity Tempe cell presented here to calibrate petrophysical models and carefully upscale them to field applications.

摘要

准确且大规模地评估体积含水量(VWC)在采矿废弃物监测中对于减轻潜在的岩土工程和环境风险起着关键作用。近年来,时移电阻率层析成像(TL - ERT)已成为一种有前景的监测方法,可与传统的侵入式和点测量技术结合使用,以估算尾矿中的VWC。此外,利用TL - ERT成像的体积电导率(EC)可在现场通过实验室校准的岩石物理关系转换为VWC。本研究首次评估了尺度效应对尾矿中ERT预测VWC准确性的影响。在实验室和现场,对五个不同尺度的尾矿同时进行了体积EC和VWC的共定位监测。水文地球物理数据集用于校准一个用于从TL - ERT数据预测VWC的岩石物理模型。总体而言,ERT预测VWC的准确率为[公式:见原文],并且在实验室样本尺度确定的岩石物理模型在更大尺度上仍然有效。值得注意的是,温度和孔隙水EC演化的影响在现场尺度的VWC预测中起主要作用(准确率降低十倍),因此,在使用互补水文地质传感器进行TL - ERT数据处理时必须适当考虑。基于这些结果,我们建议未来使用TL - ERT预测尾矿中VWC的研究可以使用类似于本文介绍的电阻率坦佩电池的样本尺度实验室设备来校准岩石物理模型,并谨慎地将其扩展到现场应用。

https://cdn.ncbi.nlm.nih.gov/pmc/blobs/04d0/10684595/3ff362984334/41598_2023_48100_Fig15_HTML.jpg
https://cdn.ncbi.nlm.nih.gov/pmc/blobs/04d0/10684595/b53b6473402d/41598_2023_48100_Fig1_HTML.jpg
https://cdn.ncbi.nlm.nih.gov/pmc/blobs/04d0/10684595/192243d03ce3/41598_2023_48100_Fig2_HTML.jpg
https://cdn.ncbi.nlm.nih.gov/pmc/blobs/04d0/10684595/0611851bae6f/41598_2023_48100_Fig3_HTML.jpg
https://cdn.ncbi.nlm.nih.gov/pmc/blobs/04d0/10684595/2c443220aeaa/41598_2023_48100_Fig4_HTML.jpg
https://cdn.ncbi.nlm.nih.gov/pmc/blobs/04d0/10684595/43a18c7d156e/41598_2023_48100_Fig5_HTML.jpg
https://cdn.ncbi.nlm.nih.gov/pmc/blobs/04d0/10684595/1a2ca75c2ea7/41598_2023_48100_Fig6_HTML.jpg
https://cdn.ncbi.nlm.nih.gov/pmc/blobs/04d0/10684595/44398f129863/41598_2023_48100_Fig7_HTML.jpg
https://cdn.ncbi.nlm.nih.gov/pmc/blobs/04d0/10684595/efb7c59cb260/41598_2023_48100_Fig8_HTML.jpg
https://cdn.ncbi.nlm.nih.gov/pmc/blobs/04d0/10684595/d96baa30c084/41598_2023_48100_Fig9_HTML.jpg
https://cdn.ncbi.nlm.nih.gov/pmc/blobs/04d0/10684595/222b39f9a95e/41598_2023_48100_Fig10_HTML.jpg
https://cdn.ncbi.nlm.nih.gov/pmc/blobs/04d0/10684595/d4277a5e6841/41598_2023_48100_Fig11_HTML.jpg
https://cdn.ncbi.nlm.nih.gov/pmc/blobs/04d0/10684595/42c276d47a36/41598_2023_48100_Fig12_HTML.jpg
https://cdn.ncbi.nlm.nih.gov/pmc/blobs/04d0/10684595/49da7cfca53a/41598_2023_48100_Fig13_HTML.jpg
https://cdn.ncbi.nlm.nih.gov/pmc/blobs/04d0/10684595/71e971ef1113/41598_2023_48100_Fig14_HTML.jpg
https://cdn.ncbi.nlm.nih.gov/pmc/blobs/04d0/10684595/3ff362984334/41598_2023_48100_Fig15_HTML.jpg

相似文献

1
A multiscale accuracy assessment of moisture content predictions using time-lapse electrical resistivity tomography in mine tailings.利用延时电阻层析成像技术对尾矿含水量预测进行的多尺度精度评估。
Sci Rep. 2023 Nov 27;13(1):20922. doi: 10.1038/s41598-023-48100-w.
2
A Review on Applications of Time-Lapse Electrical Resistivity Tomography Over the Last 30 Years : Perspectives for Mining Waste Monitoring.过去30年时间推移式电阻层析成像技术的应用综述:采矿废弃物监测展望
Surv Geophys. 2022;43(6):1699-1759. doi: 10.1007/s10712-022-09731-2. Epub 2022 Aug 12.
3
Gravimetric water distribution assessment from geoelectrical methods (ERT and EMI) in municipal solid waste landfill.基于地电方法(ERT和EMI)的城市固体废弃物填埋场重量法水分分布评估
Waste Manag. 2016 Sep;55:129-40. doi: 10.1016/j.wasman.2016.02.013. Epub 2016 Feb 28.
4
Time-Lapse Electrical Geophysical Monitoring of Amendment-Based Biostimulation.基于修正的生物刺激的延时地球物理电监测
Ground Water. 2015 Nov-Dec;53(6):920-32. doi: 10.1111/gwat.12291. Epub 2014 Dec 2.
5
4D interpretation of time-lapse electrical resistivity monitoring data to identify preferential flow path in a landfill, South Korea.
Environ Monit Assess. 2023 Apr 29;195(5):625. doi: 10.1007/s10661-023-11149-1.
6
Monitoring Soil Moisture Dynamics Using Electrical Resistivity Tomography under Homogeneous Field Conditions.在均匀田间条件下使用电阻层析成像监测土壤水分动态
Sensors (Basel). 2020 Sep 17;20(18):5313. doi: 10.3390/s20185313.
7
Evaluating four-dimensional time-lapse electrical resistivity tomography for monitoring DNAPL source zone remediation.评估用于监测重质非水相液体源区修复的四维时移电阻层析成像技术。
J Contam Hydrol. 2014 Jul;162-163:27-46. doi: 10.1016/j.jconhyd.2014.04.004. Epub 2014 May 5.
8
Use of electrical resistivity tomography for detecting the distribution of leachate and gas in a large-scale MSW landfill cell.利用电阻率层析成像技术检测大型垃圾填埋场单元中渗滤液和气体的分布。
Environ Sci Pollut Res Int. 2019 Jul;26(20):20325-20343. doi: 10.1007/s11356-019-05308-6. Epub 2019 May 16.
9
Long-term ERT monitoring of biogeochemical changes of an aged hydrocarbon contamination.对老化碳氢化合物污染生物地球化学变化的长期酶替代疗法监测
J Contam Hydrol. 2017 Jun;201:19-29. doi: 10.1016/j.jconhyd.2017.04.003. Epub 2017 Apr 10.
10
Electrical resistivity imaging for detection of hydrogeological active zones in karst areas to identify the site of mining waste disposal.电阻率成像技术在岩溶地区探测水文地质活动带,以确定采矿废物处置场的位置。
Environ Sci Pollut Res Int. 2020 Jun;27(18):22486-22498. doi: 10.1007/s11356-020-08738-9. Epub 2020 Apr 21.

引用本文的文献

1
Monitoring water percolation in a laboratory compacted soil dam using time-lapse electrical resistivity tomography.利用延时电阻层析成像技术监测实验室压实土坝中的水渗透情况。
Sci Rep. 2025 Apr 24;15(1):14356. doi: 10.1038/s41598-025-99325-w.

本文引用的文献

1
A Review on Applications of Time-Lapse Electrical Resistivity Tomography Over the Last 30 Years : Perspectives for Mining Waste Monitoring.过去30年时间推移式电阻层析成像技术的应用综述:采矿废弃物监测展望
Surv Geophys. 2022;43(6):1699-1759. doi: 10.1007/s10712-022-09731-2. Epub 2022 Aug 12.
2
Quantitative water content estimation in landfills through joint inversion of seismic refraction and electrical resistivity data considering surface conduction.通过考虑地表传导的地震折射和电阻率数据联合反演估算垃圾填埋场中的定量含水量。
Waste Manag. 2022 Jul 15;149:21-32. doi: 10.1016/j.wasman.2022.05.020. Epub 2022 Jun 11.
3
Soil Water Content Prediction Using Electrical Resistivity Tomography (ERT) in Mediterranean Tree Orchard Soils.
利用电阻率层析成像(ERT)预测地中海果园土壤的水分含量。
Sensors (Basel). 2022 Feb 10;22(4):1365. doi: 10.3390/s22041365.
4
Application of electrical resistivity tomography (ERT) for rock mass quality evaluation.电阻率层析成像(ERT)在岩体质量评价中的应用。
Sci Rep. 2021 Dec 8;11(1):23683. doi: 10.1038/s41598-021-03217-8.
5
Assessing the behaviour of heavy metals in abandoned phosphogypsum deposits combining electrical resistivity tomography and multivariate analysis.结合电阻率层析成像和多元分析评估废弃磷石膏矿床中重金属的行为。
J Environ Manage. 2021 Jan 15;278(Pt 1):111517. doi: 10.1016/j.jenvman.2020.111517. Epub 2020 Oct 26.
6
Geophysical early warning of salt precipitation during geological carbon sequestration.地质碳封存过程中盐类沉淀的地球物理早期预警
Sci Rep. 2020 Oct 5;10(1):16472. doi: 10.1038/s41598-020-73091-3.
7
Groundwater Throughflow and Seawater Intrusion in High Quality Coastal Aquifers.优质海岸含水层中的地下水径流与海水入侵
Sci Rep. 2020 Jun 17;10(1):9866. doi: 10.1038/s41598-020-66516-6.
8
Deep Electrical Resistivity Tomography for a 3D picture of the most active sector of Campi Flegrei caldera.深电阻率层析成像技术获取坎皮弗莱格雷火山口最活跃扇区的三维图像。
Sci Rep. 2019 Oct 22;9(1):15124. doi: 10.1038/s41598-019-51568-0.
9
Complex resistivity characteristics of saltwater-intruded sand contaminated by heavy metal.受重金属污染的咸水入侵砂的复电阻率特性
Sci Rep. 2019 Jul 29;9(1):10944. doi: 10.1038/s41598-019-47167-8.
10
Mapping the conductivity of graphene with Electrical Resistance Tomography.用电电阻层析成像法绘制石墨烯的电导率图。
Sci Rep. 2019 Jul 23;9(1):10655. doi: 10.1038/s41598-019-46713-8.