Department of Surgical Oncology, The First Affiliated Hospital, Zhejiang University School of Medicine, Hangzhou 310000, China.
Department of Gastroenterology, The Second Affiliated Hospital, Zhejiang University School of Medicine, Hangzhou 310000, China.
Curr Oncol. 2023 Dec 22;31(1):84-96. doi: 10.3390/curroncol31010006.
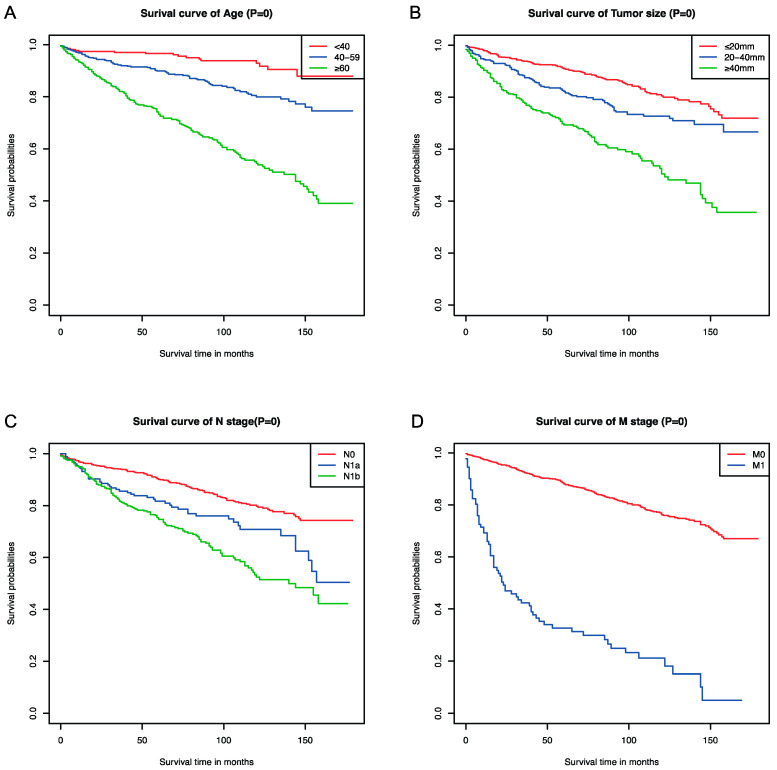
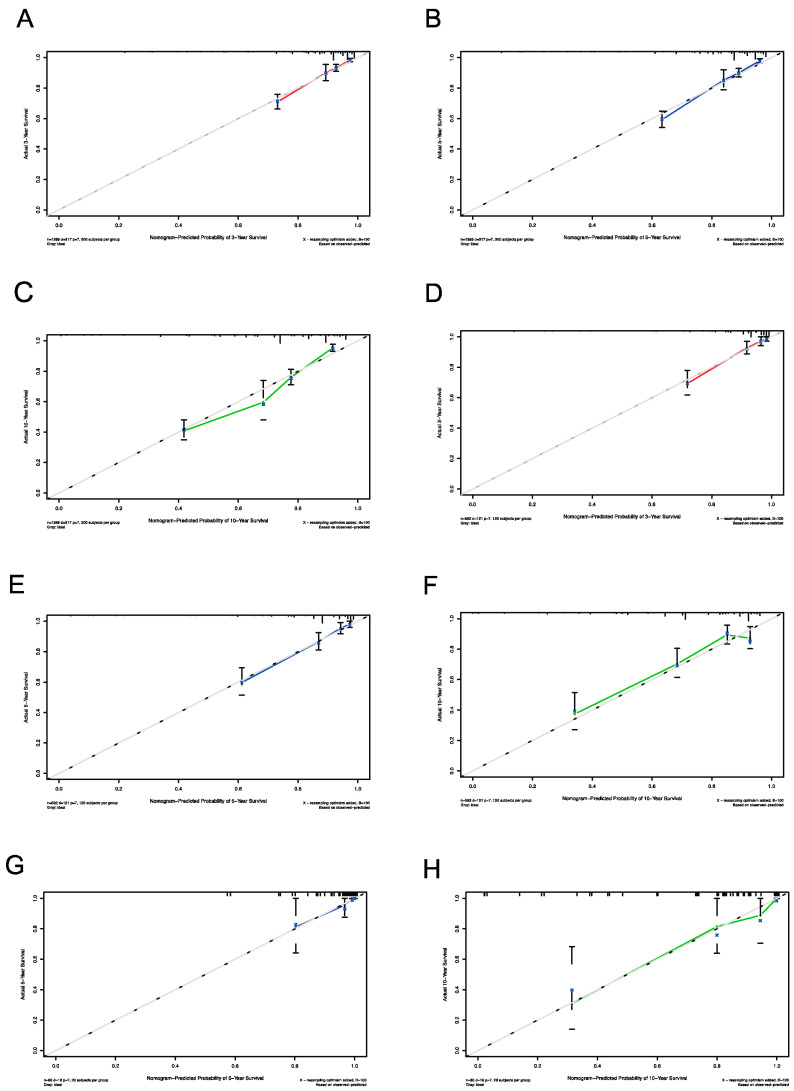
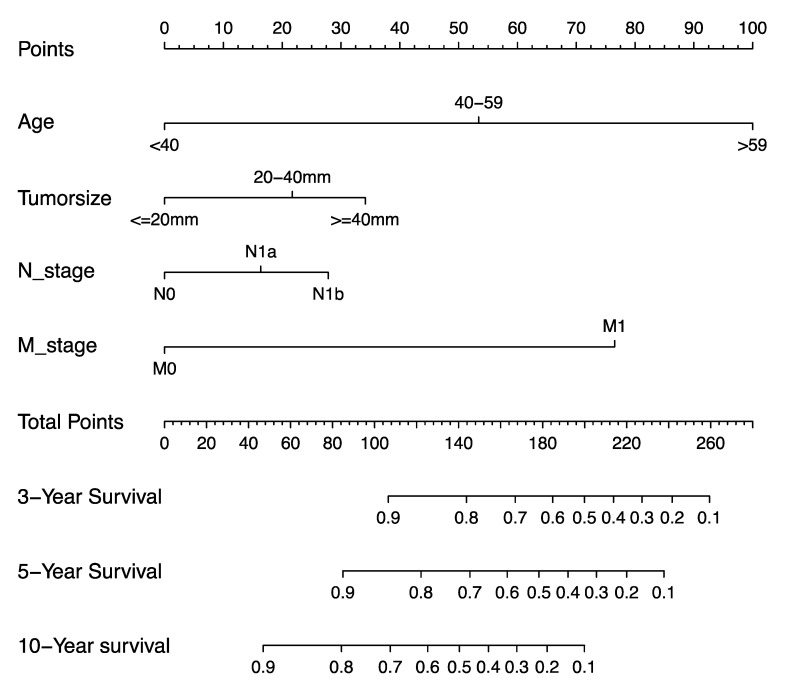
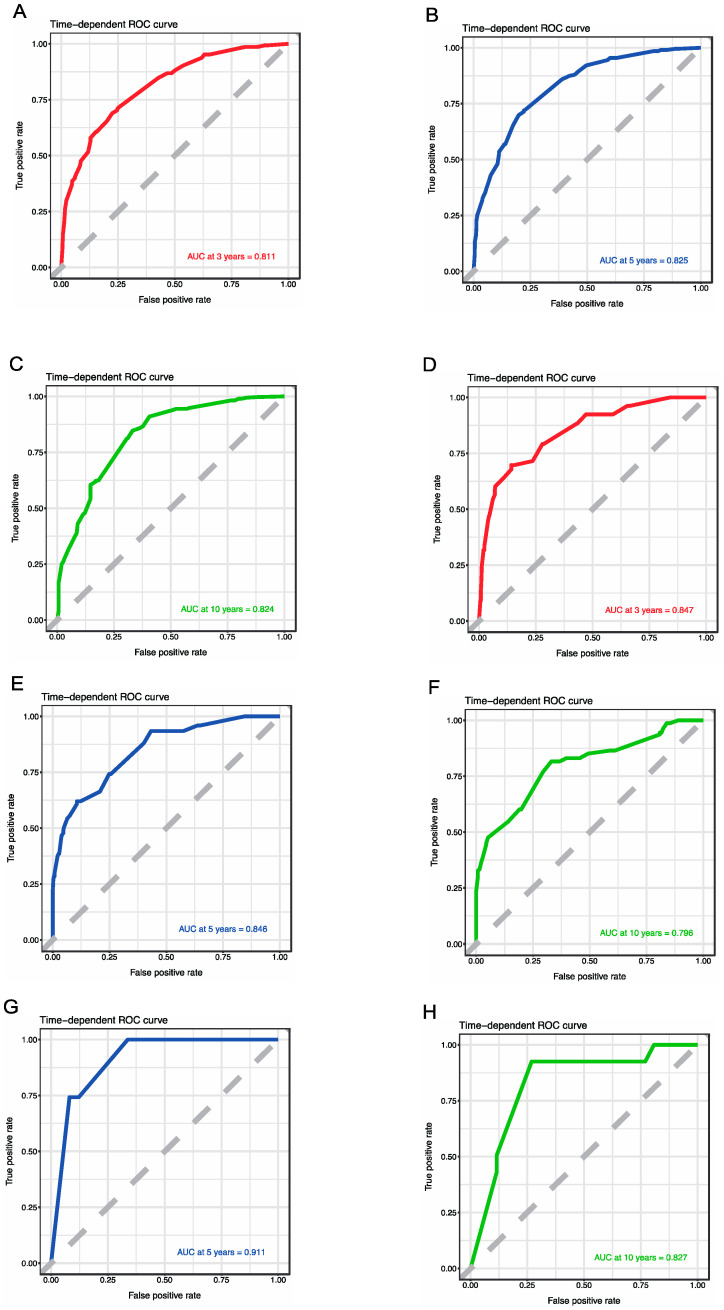
(1) Background: This study aimed to establish a nomogram model for predicting the overall survival (OS) of medullary thyroid carcinoma (MTC) patients based on the Surveillance, Epidemiology, and End Results (SEER) database. (2) Methods: Patients with MTC in the SEER database from 2004 to 2015 were included and divided into a modeling group and an internal validation group. We also selected MTC patients from our center from 2007 to 2019 to establish an external validation group. Univariate and multivariate Cox regression analyses were used to screen for significant independent variables and to establish a nomogram model. Kaplan-Meier (K-M) curves were plotted to evaluate the influence of the predictors. The C-indexes, areas under the curves (AUCs), and calibration curves were plotted to validate the predictive effect of the model. (3) Results: A total of 1981 MTC patients from the SEER database and 85 MTC patients from our center were included. The univariate and multivariate Cox regression analyses showed that age, tumor size, N stage, and M stage were significant factors, and a nomogram model was established. The C-index of the modeling group was 0.792, and the AUCs were 0.811, 0.825, and 0.824. The C-index of the internal validation group was 0.793, and the AUCs were 0.847, 0.846, and 0.796. The C-index of the external validation group was 0.871, and the AUCs were 0.911 and 0.827. The calibration curves indicated that the prediction ability was reliable. (4) Conclusions: A nomogram model based on age, tumor size, N stage, and M stage was able to predict the OS of MTC patients.
(1) 背景:本研究旨在基于监测、流行病学和最终结果(SEER)数据库建立预测甲状腺髓样癌(MTC)患者总生存期(OS)的列线图模型。
(2) 方法:纳入 SEER 数据库中 2004 年至 2015 年的 MTC 患者,分为建模组和内部验证组。还从我们中心选择了 2007 年至 2019 年的 MTC 患者,建立外部验证组。采用单因素和多因素 Cox 回归分析筛选显著的独立变量,并建立列线图模型。绘制 Kaplan-Meier(K-M)曲线评估预测因素的影响。绘制 C 指数、曲线下面积(AUC)和校准曲线以验证模型的预测效果。
(3) 结果:共纳入 SEER 数据库中的 1981 例 MTC 患者和我们中心的 85 例 MTC 患者。单因素和多因素 Cox 回归分析显示,年龄、肿瘤大小、N 分期和 M 分期是显著因素,并建立了列线图模型。建模组的 C 指数为 0.792,AUC 分别为 0.811、0.825 和 0.824。内部验证组的 C 指数为 0.793,AUC 分别为 0.847、0.846 和 0.796。外部验证组的 C 指数为 0.871,AUC 分别为 0.911 和 0.827。校准曲线表明预测能力可靠。
(4) 结论:基于年龄、肿瘤大小、N 分期和 M 分期的列线图模型能够预测 MTC 患者的 OS。