Guo Tongshuai, Zheng Sirui, Chen Tao, Chu Chao, Ren Jie, Sun Yue, Wang Yang, He Mingjun, Yan Yu, Jia Hao, Liao Yueyuan, Cao Yumeng, Du Mingfei, Wang Dan, Yuan Zuyi, Wang Duolao, Mu Jianjun
Department of Cardiology, First Affiliated Hospital of Medical School, Xi'an Jiaotong University, Xi'an, 710061, China.
Biostatistics Unit, Department of Clinical Sciences, Liverpool School of Tropical Medicine, Pembroke Place, Liverpool, L3 5QA, UK.
EClinicalMedicine. 2024 Feb 12;69:102486. doi: 10.1016/j.eclinm.2024.102486. eCollection 2024 Mar.
Limited data exists on how early-life weight changes relate to metabolic syndrome (MetS) risk in midlife. This study examines the association between long-term trajectories of body mass index (BMI), its variability, and MetS risk in Chinese individuals.
In the Hanzhong Adolescent Hypertension study (March 10, 1987-June 3, 2017), 1824 participants with at least five BMI measurements from 1987 to 2017 were included. Using group-based trajectory modeling, different BMI trajectories were identified. BMI variability was assessed through standard deviation (SD), variability independent of the mean (VIM), and average real variability (ARV). Logistic regression analyzed the relationship between BMI trajectory, BMI variability, and MetS occurrence in midlife (URL: https://www.clinicaltrials.gov; Unique identifier: NCT02734472).
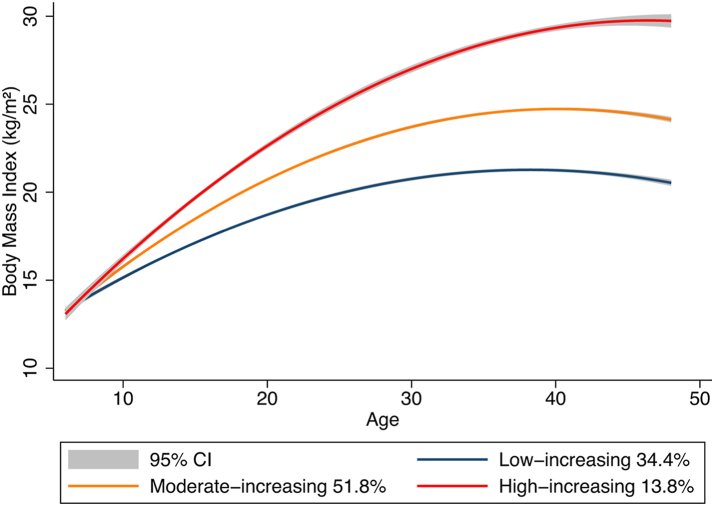
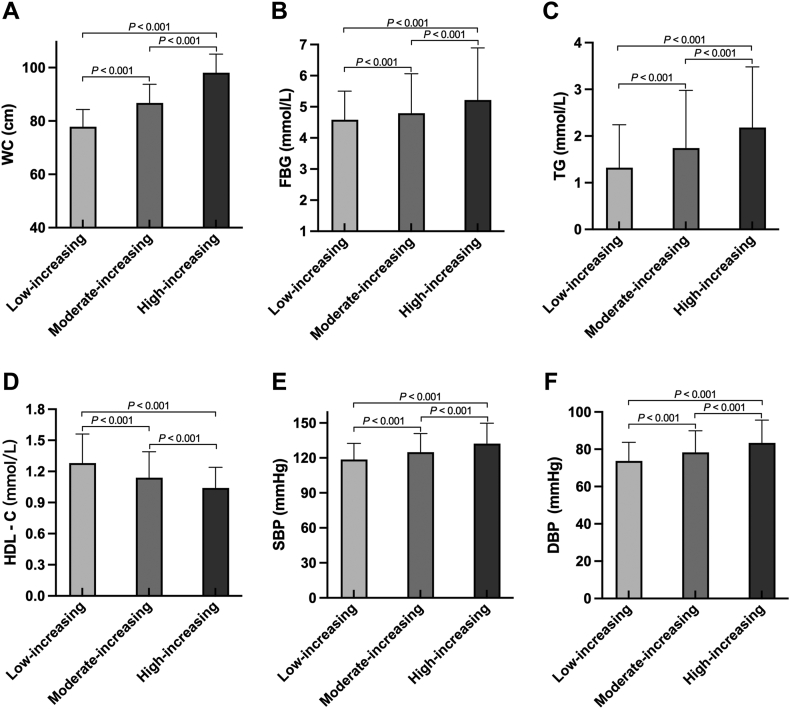
BMI trajectories were categorized as low-increasing (34.4%), moderate-increasing (51.8%), and high-increasing (13.8%). Compared to the low-increasing group, the odds ratios (ORs) [95% CIs] for MetS were significantly higher in moderate (4.27 [2.63-6.91]) and high-increasing groups (13.11 [6.30-27.31]) in fully adjusted models. Additionally, higher BMI variabilities were associated with increased MetS odds (ORs for SD, VIM, and ARV: 2.30 [2.02-2.62], 1.22 [1.19-1.26], and 4.29 [3.38-5.45]). Furthermore, BMI trajectories from childhood to adolescence were predictive of midlife MetS, with ORs in moderate (1.49 [1.00-2.23]) and high-increasing groups (2.45 [1.22-4.91]). Lastly, elevated BMI variability in this period was also linked to higher MetS odds (ORs for SD, VIM, and ARV: 1.24 [1.08-1.42], 1.00 [1.00-1.01], and 1.21 [1.05-1.38]).
Our study suggests that both early-life BMI trajectories and BMI variability could be predictive of incident MetS in midlife.
This work was supported by the National Natural Science Foundation of China No. 82070437 (J.-J.M.), the Clinical Research Award of the First Affiliated Hospital of Xi'an Jiaotong University of China (No. XJTU1AF-CRF-2022-002, XJTU1AF2021CRF-021, and XJTU1AF-CRF-2023-004), the Key R&D Projects in Shaanxi Province (Grant No. 2023-ZDLSF-50), the Chinese Academy of Medical Sciences & Peking Union Medical College (2017-CXGC03-2), and the International Joint Research Centre for Cardiovascular Precision Medicine of Shaanxi Province (2020GHJD-14).
关于生命早期体重变化与中年代谢综合征(MetS)风险之间的关系,现有数据有限。本研究探讨了中国人群体重指数(BMI)的长期轨迹、其变异性与MetS风险之间的关联。
在汉中青少年高血压研究(1987年3月10日至2017年6月3日)中,纳入了1824名在1987年至2017年期间至少有五次BMI测量值的参与者。使用基于群体的轨迹模型,识别出不同的BMI轨迹。通过标准差(SD)、独立于均值的变异性(VIM)和平均实际变异性(ARV)评估BMI变异性。采用逻辑回归分析BMI轨迹、BMI变异性与中年MetS发生之间的关系(网址:https://www.clinicaltrials.gov;唯一标识符:NCT02734472)。
BMI轨迹分为低增长型(34.4%)、中度增长型(51.8%)和高增长型(13.8%)。在完全调整模型中,与低增长组相比,中度增长组(4.27 [2.63 - 6.91])和高增长组(13.11 [6.30 - 27.31])发生MetS的比值比(OR)[95%置信区间]显著更高。此外,较高的BMI变异性与MetS发生几率增加相关(SD、VIM和ARV的OR分别为:2.30 [2.02 - 2.62]、1.22 [1.19 - 1.26]和4.29 [3.38 - 5.45])。此外,从儿童期到青春期的BMI轨迹可预测中年MetS,中度增长组(1.49 [1.00 - 2.23])和高增长组(2.45 [1.22 - 4.91])的OR值均如此。最后,这一时期BMI变异性升高也与MetS发生几率较高相关(SD、VIM和ARV的OR分别为:1.24 [1.08 - 1.42]、1.00 [1.00 - 1.01]和1.21 [1.05 - 1.38])。
我们的研究表明,生命早期的BMI轨迹和BMI变异性均可能预测中年时MetS的发生。
本研究得到了中国国家自然科学基金(项目编号:82070437,J.-J.M.)、西安交通大学第一附属医院临床研究奖(编号:XJTU1AF-CRF-2022-002、XJTU1AF2021CRF-021和XJTU1AF-CRF-2023-004)、陕西省重点研发计划项目(项目编号:2023-ZDLSF-50)、中国医学科学院&北京协和医学院(2017-CXGC03-2)以及陕西省心血管精准医学国际联合研究中心(2020GHJD-14)的资助。