Dimech Adam M, Kaur Sukhjiwan, Breen Edmond J
Agriculture Victoria Research, Department of Energy, Environment and Climate Action, AgriBio Centre for AgriBioscience, Bundoora, VIC, 3083, Australia.
School of Applied Systems Biology, La Trobe University, Bundoora, VIC, 3083, Australia.
Plant Methods. 2024 Jun 19;20(1):95. doi: 10.1186/s13007-024-01223-1.
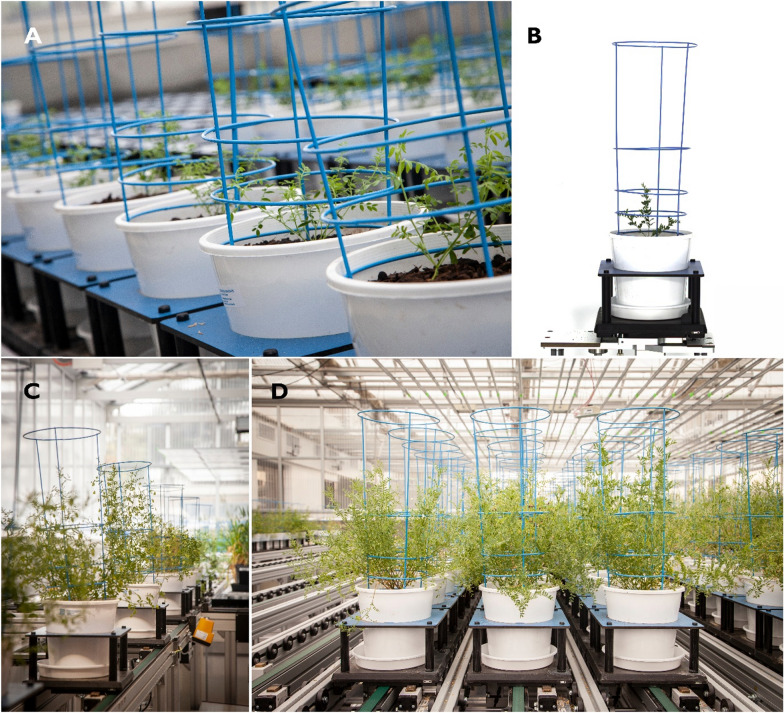
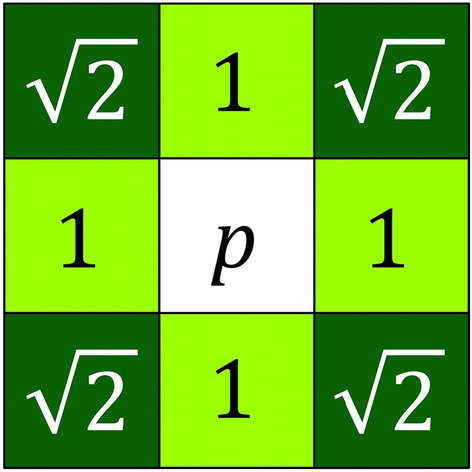
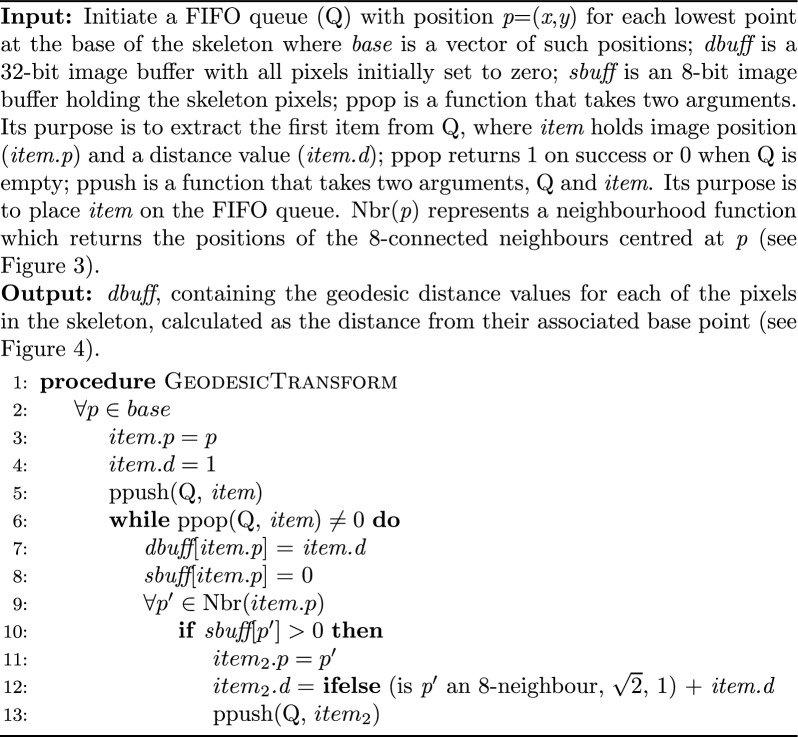
Lentil (Lens culinaris Medik.) is a globally-significant agricultural crop used to feed millions of people. Lentils have been cultivated in the Australian states of Victoria and South Australia for several decades, but efforts are now being made to expand their cultivation into Western Australia and New South Wales. Plant architecture plays a pivotal role in adaptation, leading to improved and stable yields especially in new expansion regions. Image-based high-throughput phenomics technologies provide opportunities for an improved understanding of plant development, architecture, and trait genetics. This paper describes a novel method for mapping and quantifying individual branch structures on immature glasshouse-grown lentil plants grown using a LemnaTec Scanalyser 3D high-throughput phenomics platform, which collected side-view RGB images at regular intervals under controlled photographic conditions throughout the experiment. A queue and distance-based algorithm that analysed morphological skeletons generated from images of lentil plants was developed in Python. This code was incorporated into an image analysis pipeline using open-source software (PlantCV) to measure the number, angle, and length of individual branches on lentil plants.
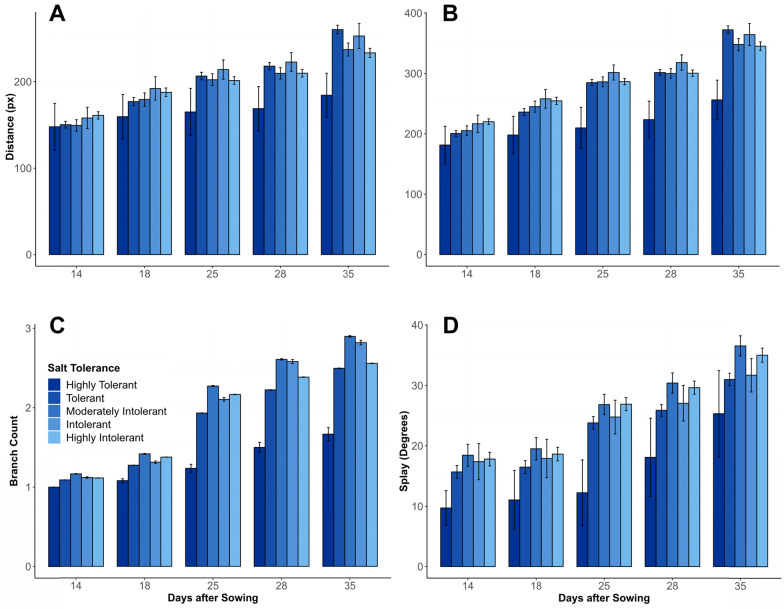
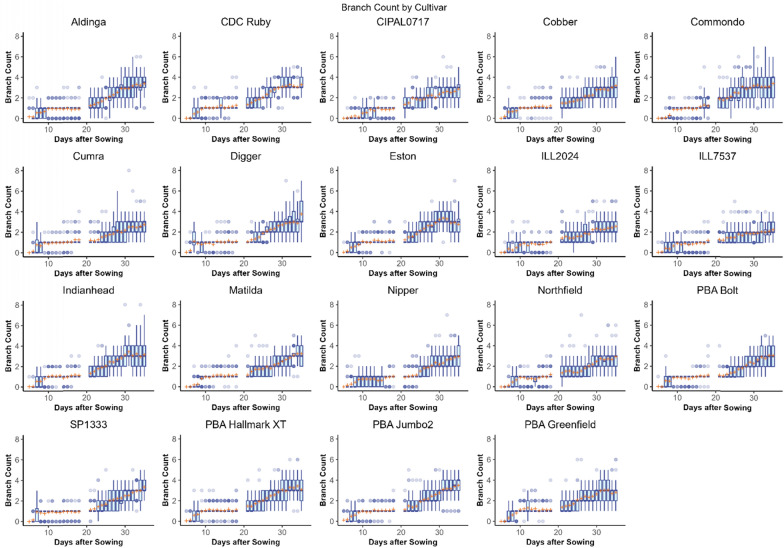
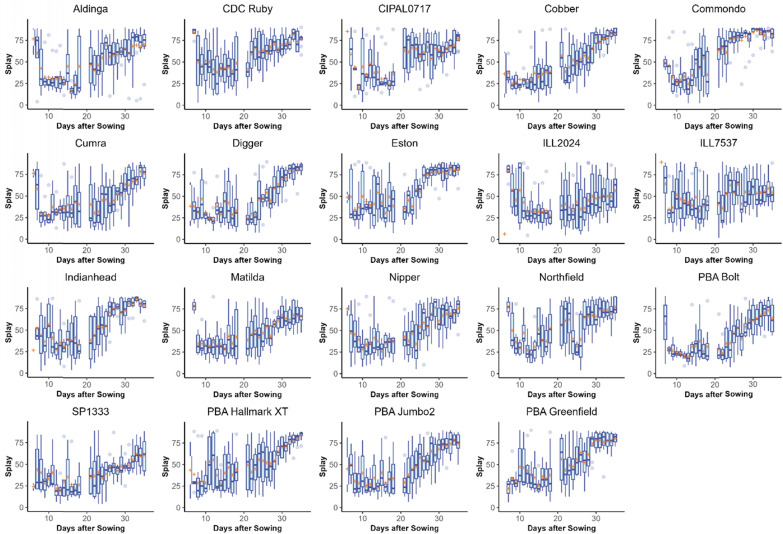
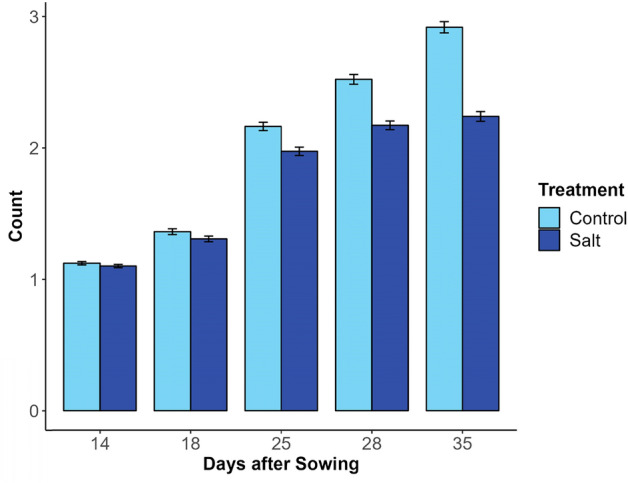
Branching structures could be accurately identified and quantified in immature plants, which is sufficient for calculating early vigour traits, however the accuracy declined as the plants matured. Absolute accuracy for branch counts was 77.9% for plants at 22 days after sowing (DAS), 57.9% at 29 DAS and 51.9% at 36 DAS. Allowing for an error of ± 1 branch, the associated accuracies for the same time periods were 97.6%, 90.8% and 79.2% respectively. Occlusion in more mature plants made the mapping of branches less accurate, but the information collected could still be useful for trait estimation. For branch length calculations, the amount of variance explained by linear mixed-effects models was 82% for geodesic length and 87% for Euclidean branch lengths. Within these models, both the mean geodesic and Euclidean distance measurements of branches were found to be significantly affected by genotype, DAS and their interaction. Two informative metrices were derived from the calculations of branch angle; 'splay' is a measure of how far a branch angle deviates from being fully upright whilst 'angle-difference' is the difference between the smallest and largest recorded branch angle on each plant. The amount of variance explained by linear mixed-effects models was 38% for splay and 50% for angle difference. These lower R values are likely due to the inherent difficulties in measuring these parameters, nevertheless both splay and angle difference were found to be significantly affected by cultivar, DAS and their interaction. When 276 diverse lentil genotypes with varying degrees of salt tolerance were grown in a glasshouse-based experiment where a portion were subjected to a salt treatment, the branching algorithm was able to distinguish between salt-treated and untreated lentil lines based on differences in branch counts. Likewise, the mean geodesic and Euclidean distance measurements of branches were both found to be significantly affected by cultivar, DAS and salt treatment. The amount of variance explained by the linear mixed-effects models was 57.8% for geodesic branch length and 46.5% for Euclidean branch length.
The methodology enabled the accurate quantification of the number, angle, and length of individual branches on glasshouse-grown lentil plants. This methodology could be applied to other dicotyledonous species.
小扁豆(Lens culinaris Medik.)是一种具有全球重要意义的农作物,为数百万人提供食物。小扁豆已在澳大利亚的维多利亚州和南澳大利亚州种植了几十年,但目前正在努力将其种植扩展到西澳大利亚州和新南威尔士州。植株结构在适应性方面起着关键作用,有助于提高产量并使其稳定,特别是在新的扩展种植区域。基于图像的高通量表型组学技术为更好地理解植物发育、结构和性状遗传学提供了机会。本文描述了一种新方法,用于对在温室中生长的未成熟小扁豆植株上的单个分支结构进行映射和量化,该植株使用LemnaTec Scanalyser 3D高通量表型组学平台种植,在整个实验过程中,在受控的摄影条件下定期采集侧视RGB图像。在Python中开发了一种基于队列和距离的算法,用于分析从小扁豆植株图像生成的形态骨架。此代码被整合到一个使用开源软件(PlantCV)的图像分析管道中,以测量小扁豆植株上单个分支的数量、角度和长度。
在未成熟植株中,可以准确识别和量化分支结构,这足以计算早期活力性状,然而随着植株成熟,准确性会下降。播种后22天(DAS)的植株分支计数绝对准确率为77.9%,29 DAS时为57.9%,36 DAS时为51.9%。允许有±1个分支的误差,相同时间段的相关准确率分别为97.6%、90.8%和79.2%。在更成熟的植株中,遮挡使得分支映射不太准确,但收集到的信息仍可用于性状估计。对于分支长度计算,线性混合效应模型解释的方差量,测地线长度为82%,欧几里得分支长度为87%。在这些模型中,发现分支的平均测地线和欧几里得距离测量值均受到基因型、DAS及其相互作用的显著影响。从分支角度计算得出两个有用的指标;“展开度”衡量分支角度偏离完全直立的程度,而“角度差”是每株植物上记录的最小和最大分支角度之间的差值。线性混合效应模型解释的方差量,展开度为38%,角度差为50%。这些较低的R值可能是由于测量这些参数存在固有困难,尽管如此,展开度和角度差均受到品种、DAS及其相互作用的显著影响。当在温室实验中种植276种不同程度耐盐性的小扁豆基因型,其中一部分进行盐处理时,分支算法能够根据分支计数的差异区分盐处理和未处理的小扁豆品系。同样,发现分支的平均测地线和欧几里得距离测量值均受到品种、DAS和盐处理的显著影响。线性混合效应模型解释的方差量,测地线分支长度为57.8%,欧几里得分支长度为46.5%。
该方法能够准确量化温室种植的小扁豆植株上单个分支的数量、角度和长度。此方法可应用于其他双子叶植物物种。