Department of Epidemiology, Guangdong Provincial Key Laboratory of Food, Nutrition and Health, School of Public Health, Sun Yat-Sen University, Guangzhou, 510275, China.
Westlake Center for Intelligent Proteomics, Westlake Laboratory of Life Sciences and Biomedicine, Hangzhou, China.
Cardiovasc Diabetol. 2024 Aug 31;23(1):322. doi: 10.1186/s12933-024-02409-6.
Continuous glucose monitoring (CGM) devices provide detailed information on daily glucose control and glycemic variability. Yet limited population-based studies have explored the association between CGM metrics and fatty liver. We aimed to investigate the associations of CGM metrics with the degree of hepatic steatosis.
This cross-sectional study included 1180 participants from the Guangzhou Nutrition and Health Study. CGM metrics, covering mean glucose level, glycemic variability, and in-range measures, were separately processed for all-day, nighttime, and daytime periods. Hepatic steatosis degree (healthy: n = 698; mild steatosis: n = 242; moderate/severe steatosis: n = 240) was determined by magnetic resonance imaging proton density fat fraction. Multivariate ordinal logistic regression models were conducted to estimate the associations between CGM metrics and steatosis degree. Machine learning models were employed to evaluate the predictive performance of CGM metrics for steatosis degree.
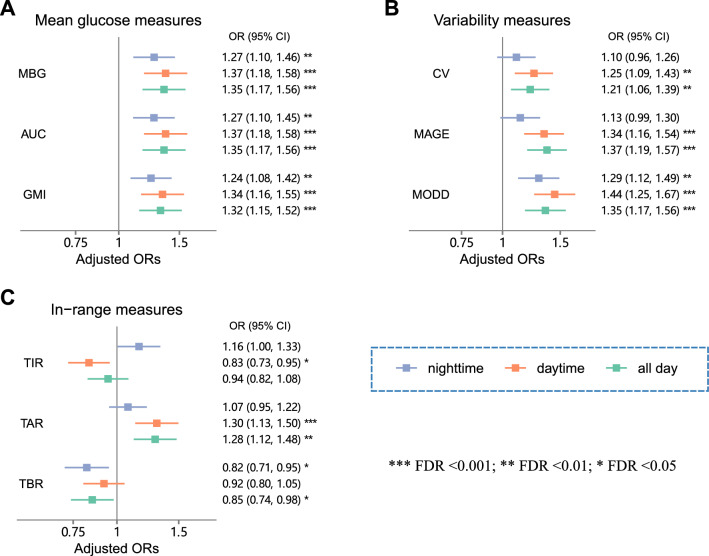
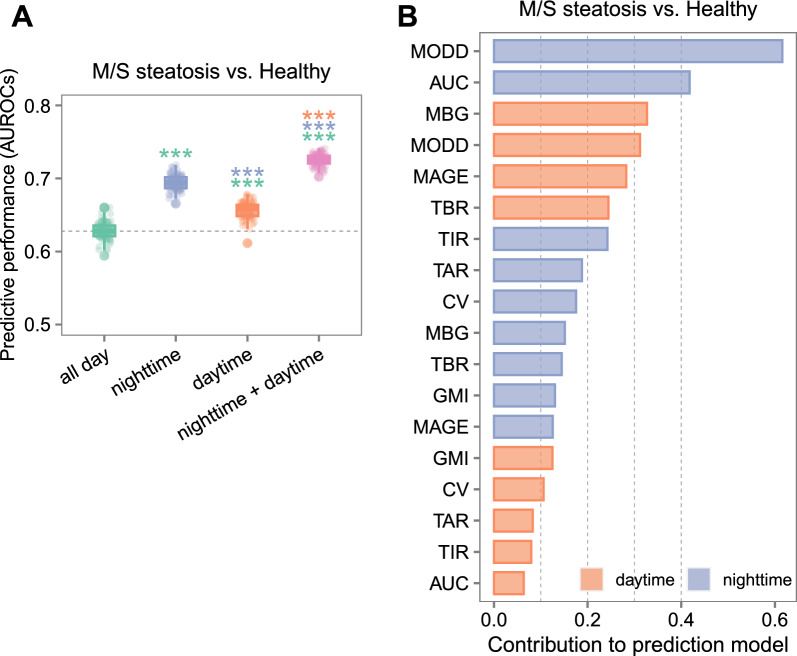
Mean blood glucose, coefficient of variation (CV) of glucose, mean amplitude of glucose excursions (MAGE), and mean of daily differences (MODD) were positively associated with steatosis degree, with corresponding odds ratios (ORs) and 95% confidence intervals (CIs) of 1.35 (1.17, 1.56), 1.21 (1.06, 1.39), 1.37 (1.19, 1.57), and 1.35 (1.17, 1.56) during all-day period. Notably, lower daytime time in range (TIR) and higher nighttime TIR were associated with higher steatosis degree, with ORs (95% CIs) of 0.83 (0.73, 0.95) and 1.16 (1.00, 1.33), respectively. For moderate/severe steatosis (vs. healthy) prediction, the average area under the receiver operating characteristic curves were higher for the nighttime (0.69) and daytime (0.66) metrics than that of all-day metrics (0.63, P < 0.001 for all comparisons). The model combining both nighttime and daytime metrics achieved the highest predictive capacity (0.73), with nighttime MODD emerging as the most important predictor.
Higher CGM-derived mean glucose and glycemic variability were linked with higher steatosis degree. CGM-derived metrics during nighttime and daytime provided distinct and complementary insights into hepatic steatosis.
连续血糖监测(CGM)设备可提供有关日常血糖控制和血糖变异性的详细信息。然而,基于人群的研究有限,尚未探讨 CGM 指标与脂肪肝之间的关系。本研究旨在探讨 CGM 指标与肝脂肪变性程度的相关性。
本横断面研究纳入了来自广州营养与健康研究的 1180 名参与者。分别对全天、夜间和白天时间段的 CGM 指标(平均血糖水平、血糖变异性和达标范围)进行处理。采用磁共振成像质子密度脂肪分数测定肝脂肪变性程度(健康:n=698;轻度脂肪变性:n=242;中度/重度脂肪变性:n=240)。采用多变量有序逻辑回归模型评估 CGM 指标与脂肪变性程度之间的相关性。采用机器学习模型评估 CGM 指标对脂肪变性程度的预测性能。
平均血糖、血糖变异系数(CV)、平均血糖波动幅度(MAGE)和日间血糖平均差(MODD)与脂肪变性程度呈正相关,全天时对应的比值比(OR)及其 95%置信区间(CI)分别为 1.35(1.17,1.56)、1.21(1.06,1.39)、1.37(1.19,1.57)和 1.35(1.17,1.56)。值得注意的是,白天时间达标率(TIR)较低和夜间 TIR 较高与脂肪变性程度较高相关,OR(95%CI)分别为 0.83(0.73,0.95)和 1.16(1.00,1.33)。对于中度/重度脂肪变性(与健康相比)预测,夜间(0.69)和日间(0.66)指标的曲线下面积均高于全天指标(0.63,P<0.001)。联合夜间和日间指标的模型具有最高的预测能力(0.73),夜间 MODD 是最重要的预测因子。
更高的 CGM 衍生平均血糖和血糖变异性与更高的脂肪变性程度相关。夜间和日间的 CGM 衍生指标为肝脂肪变性提供了独特且互补的见解。