Centre for Infectious Diseases and Microbiology - Public Health, Westmead Hospital, Westmead, NSW, Australia.
Sydney Infectious Diseases Institute, The University of Sydney, Sydney, NSW, Australia.
Epidemiol Infect. 2024 Sep 30;152:e110. doi: 10.1017/S0950268824001092.
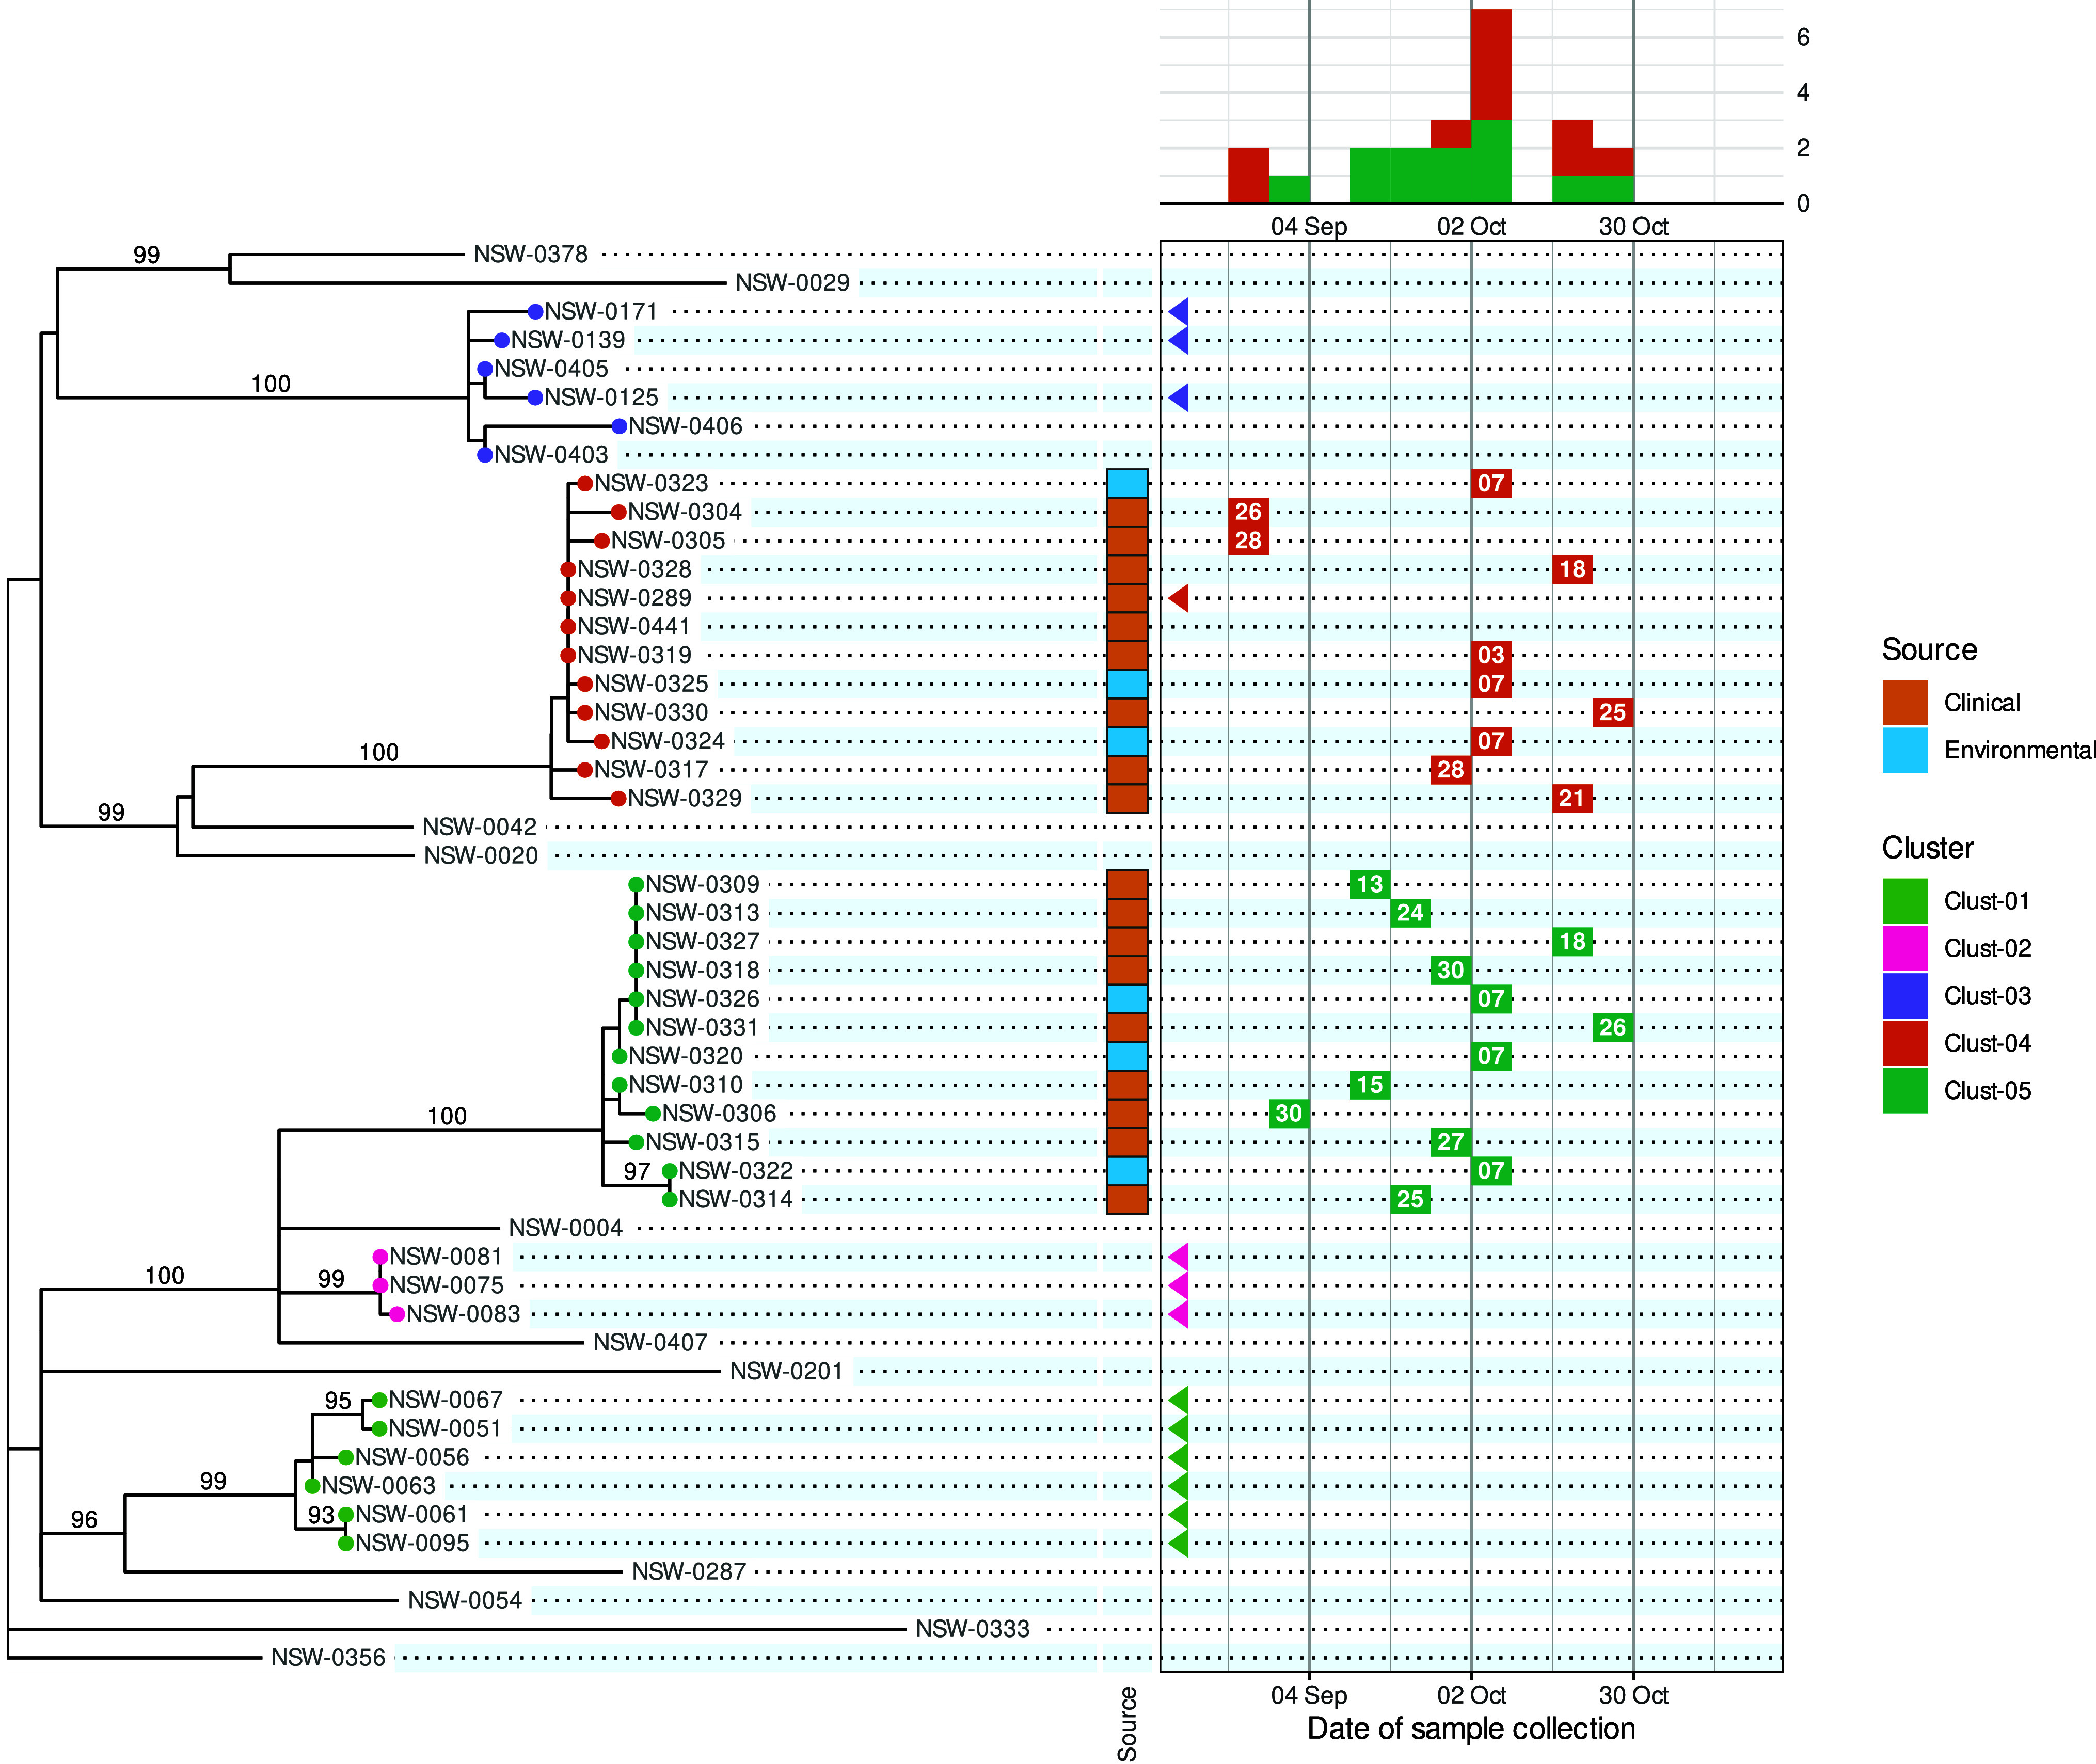
In epidemiological investigations, pathogen genomics can provide insights and test epidemiological hypotheses that would not have been possible through traditional epidemiology. Tools to synthesize genomic analysis with other types of data are a key requirement of genomic epidemiology. We propose a new 'phylepic' visualization that combines a phylogenomic tree with an epidemic curve. The combination visually links the molecular time represented in the tree to the calendar time in the epidemic curve, a correspondence that is not easily represented by existing tools. Using an example derived from a foodborne bacterial outbreak, we demonstrated that the phylepic chart communicates that what appeared to be a point-source outbreak was in fact composed of cases associated with two genetically distinct clades of bacteria. We provide an R package implementing the chart. We expect that visualizations that place genomic analyses within the epidemiological context will become increasingly important for outbreak investigations and public health surveillance of infectious diseases.
在流行病学调查中,病原体基因组学可以提供通过传统流行病学无法获得的见解和检验流行病学假设。将基因组分析与其他类型的数据相结合的工具是基因组流行病学的关键要求。我们提出了一种新的“phylepic”可视化方法,将系统发育树与流行曲线相结合。这种组合直观地将树中表示的分子时间与流行曲线中的日历时间联系起来,而现有工具很难表示这种对应关系。我们使用源自食源性细菌暴发的一个例子来说明,phylepic 图表表明,看似是单点源暴发的情况实际上是由与两种遗传上不同的细菌分支相关的病例组成的。我们提供了一个实现图表的 R 包。我们预计,将基因组分析置于流行病学背景下的可视化方法对于暴发调查和传染病的公共卫生监测将变得越来越重要。