• 文献检索
  • 文档翻译
  • 深度研究
  • 学术资讯
  • Suppr Zotero 插件Zotero 插件
  • 邀请有礼
  • 套餐&价格
  • 历史记录
应用&插件
Suppr Zotero 插件Zotero 插件浏览器插件Mac 客户端Windows 客户端微信小程序
定价
高级版会员购买积分包购买API积分包
服务
文献检索文档翻译深度研究API 文档MCP 服务
关于我们
关于 Suppr公司介绍联系我们用户协议隐私条款
关注我们

Suppr 超能文献

核心技术专利:CN118964589B侵权必究
粤ICP备2023148730 号-1Suppr @ 2026

文献检索

告别复杂PubMed语法,用中文像聊天一样搜索,搜遍4000万医学文献。AI智能推荐,让科研检索更轻松。

立即免费搜索

文件翻译

保留排版,准确专业,支持PDF/Word/PPT等文件格式,支持 12+语言互译。

免费翻译文档

深度研究

AI帮你快速写综述,25分钟生成高质量综述,智能提取关键信息,辅助科研写作。

立即免费体验

环境空气污染物(PM、PM、NO和NO)的垂直分布;系统评价。

Vertical distribution of ambient air pollutants (PM, PM, NO, and NO); A systematic review.

作者信息

Roostaei Vahid, Gharibzadeh Farzaneh, Shamsipour Mansour, Faridi Sasan, Hassanvand Mohammad Sadegh

机构信息

Department of Environmental Health Engineering, School of Public Health, Tehran University of Medical Sciences, Tehran, Iran.

Department of Research Methodology and Data Analysis, Institute for Environmental Research (IER), Tehran University of Medical Sciences, Tehran, Iran.

出版信息

Heliyon. 2024 Oct 24;10(21):e39726. doi: 10.1016/j.heliyon.2024.e39726. eCollection 2024 Nov 15.

DOI:10.1016/j.heliyon.2024.e39726
PMID:39553653
原文链接:https://pmc.ncbi.nlm.nih.gov/articles/PMC11564963/
Abstract

BACKGROUND

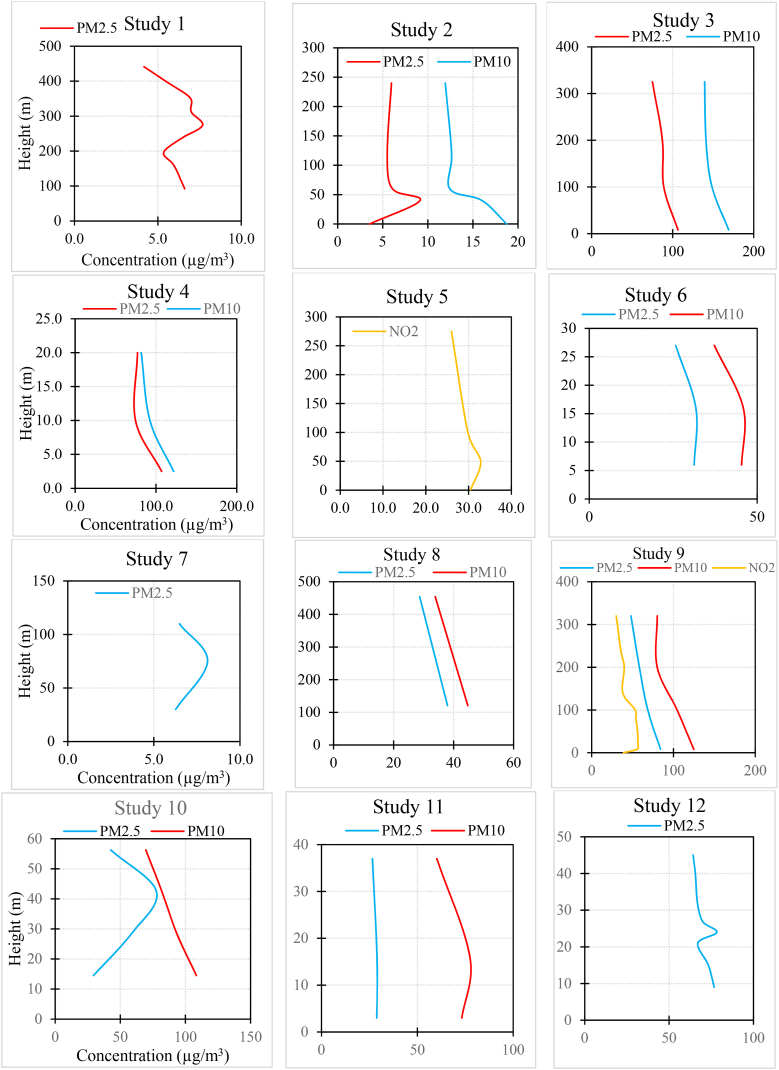
Numerous investigations have explored variations in vertical air pollutant concentrations, yielding diverse findings. So, we have conducted this systematic review to gain a more comprehensive understanding of the vertical distribution of air pollutant concentrations (PM, PM, NO, and NO) and the influencing factors.

METHODS

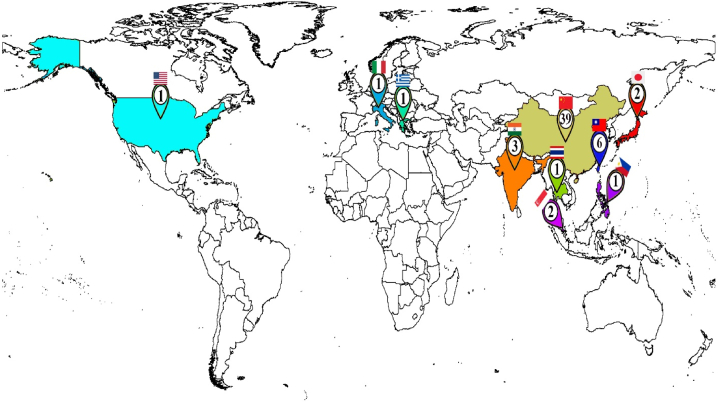
Relevant studies were identified by searching the three central electronic databases, PubMed, Web of Science, and Scopus, from the beginning of 2000 to the end of 2023. This study included original articles published in English that examine the pollutant concentration variations below 500 m.

FINDING

Of 3614 articles, 57 studies met our criteria. Our findings showed a decline in PM and NO concentrations as altitude increased, while NO concentrations exhibited an increase. Conversely, no statistically significant relationship was identified between altitude and PM concentrations. The regression analysis yielded coefficients for the relationship between concentration and altitude (0-500 m) as follows: PM (-0.11), PM/PM (0.0008), NO (-0.11), and NO (0.13). Conducting additional research on this topic and investigating the impact of meteorological parameters on pollutant concentrations at different altitudes enhances our understanding of the vertical distribution of pollutant concentrations.

摘要

背景

众多研究探讨了垂直方向上空气污染物浓度的变化,结果各异。因此,我们进行了这项系统综述,以更全面地了解空气污染物浓度(PM、PM、NO和NO)的垂直分布及影响因素。

方法

通过检索三个主要电子数据库,即PubMed、Web of Science和Scopus,确定2000年初至2023年底的相关研究。本研究纳入了以英文发表的、研究500米以下污染物浓度变化的原创文章。

结果

在3614篇文章中,57项研究符合我们的标准。我们的研究结果表明,随着海拔升高,PM和NO浓度下降,而NO浓度则上升。相反,海拔与PM浓度之间未发现统计学上的显著关系。浓度与海拔(0 - 500米)之间关系的回归分析得出的系数如下:PM(-0.11)、PM/PM(0.0008)、NO(-0.11)和NO(0.13)。对该主题进行更多研究并调查气象参数对不同海拔高度污染物浓度的影响,可增进我们对污染物浓度垂直分布的理解。

https://cdn.ncbi.nlm.nih.gov/pmc/blobs/0ac1/11564963/adc8d309bd1a/gr3a.jpg
https://cdn.ncbi.nlm.nih.gov/pmc/blobs/0ac1/11564963/5277fe4317d7/gr1.jpg
https://cdn.ncbi.nlm.nih.gov/pmc/blobs/0ac1/11564963/4eb0ab1fcee7/gr2.jpg
https://cdn.ncbi.nlm.nih.gov/pmc/blobs/0ac1/11564963/adc8d309bd1a/gr3a.jpg
https://cdn.ncbi.nlm.nih.gov/pmc/blobs/0ac1/11564963/5277fe4317d7/gr1.jpg
https://cdn.ncbi.nlm.nih.gov/pmc/blobs/0ac1/11564963/4eb0ab1fcee7/gr2.jpg
https://cdn.ncbi.nlm.nih.gov/pmc/blobs/0ac1/11564963/adc8d309bd1a/gr3a.jpg

相似文献

1
Vertical distribution of ambient air pollutants (PM, PM, NO, and NO); A systematic review.环境空气污染物(PM、PM、NO和NO)的垂直分布;系统评价。
Heliyon. 2024 Oct 24;10(21):e39726. doi: 10.1016/j.heliyon.2024.e39726. eCollection 2024 Nov 15.
2
Mortality and Morbidity Effects of Long-Term Exposure to Low-Level PM, BC, NO, and O: An Analysis of European Cohorts in the ELAPSE Project.长期暴露于低水平 PM、BC、NO 和 O 对死亡率和发病率的影响:ELAPSE 项目中欧洲队列的分析。
Res Rep Health Eff Inst. 2021 Sep;2021(208):1-127.
3
The impact of the congestion charging scheme on air quality in London. Part 1. Emissions modeling and analysis of air pollution measurements.拥堵收费计划对伦敦空气质量的影响。第1部分。排放建模与空气污染测量分析。
Res Rep Health Eff Inst. 2011 Apr(155):5-71.
4
The London low emission zone baseline study.伦敦低排放区基线研究。
Res Rep Health Eff Inst. 2011 Nov(163):3-79.
5
Association between exposure to ambient air pollution and hospital admission, incidence, and mortality of stroke: an updated systematic review and meta-analysis of more than 23 million participants.暴露于环境空气污染与卒中住院、发病和死亡的关联:超过 2300 万参与者的更新系统评价和荟萃分析。
Environ Health Prev Med. 2021 Jan 26;26(1):15. doi: 10.1186/s12199-021-00937-1.
6
[Effects of Air Pollutants on Outpatient Visits for Atopic Dermatitis in Lanzhou].[空气污染物对兰州特应性皮炎门诊就诊率的影响]
Zhongguo Yi Xue Ke Xue Yuan Xue Bao. 2021 Aug;43(4):521-530. doi: 10.3881/j.issn.1000-503X.13046.
7
Characterizing Determinants of Near-Road Ambient Air Quality for an Urban Intersection and a Freeway Site.描述城市交叉口和高速公路站点附近环境空气质量的决定因素。
Res Rep Health Eff Inst. 2022 Sep;2022(207):1-73.
8
The influence of improved air quality on mortality risks in Erfurt, Germany.德国爱尔福特空气质量改善对死亡风险的影响。
Res Rep Health Eff Inst. 2009 Feb(137):5-77; discussion 79-90.
9
Evaluating heterogeneity in indoor and outdoor air pollution using land-use regression and constrained factor analysis.利用土地利用回归和约束因子分析评估室内和室外空气污染的异质性。
Res Rep Health Eff Inst. 2010 Dec(152):5-80; discussion 81-91.
10
Association of metabolic signatures of air pollution with MASLD: Observational and Mendelian randomization study.空气污染的代谢特征与代谢相关脂肪性肝病的关联:观察性和孟德尔随机化研究
J Hepatol. 2025 Apr;82(4):560-570. doi: 10.1016/j.jhep.2024.09.033. Epub 2024 Sep 28.

本文引用的文献

1
Two Decades of Air Pollution Health Risk Assessment: Insights From the Use of WHO's AirQ and AirQ+ Tools.二十年空气污染健康风险评估:使用世界卫生组织的AirQ和AirQ+工具的见解
Public Health Rev. 2024 Jun 18;45:1606969. doi: 10.3389/phrs.2024.1606969. eCollection 2024.
2
Satellite or ground-based measurements for air pollutants (PM, PM, SO, NO, O) data and their health hazards: which is most accurate and why?卫星或地面测量的空气污染物(PM、PM、SO、NO、O)数据及其健康危害:哪种方法最准确,为什么?
Environ Monit Assess. 2024 Mar 4;196(4):342. doi: 10.1007/s10661-024-12462-z.
3
MAX-DOAS Measurements of Tropospheric NO and HCHO Vertical Profiles at the Longfengshan Regional Background Station in Northeastern China.
利用 MAX-DOAS 观测技术对中国东北龙凤山区域背景站近地层 NO 和 HCHO 柱浓度的垂直廓线分布
Sensors (Basel). 2023 Mar 20;23(6):3269. doi: 10.3390/s23063269.
4
Vertical profiles of O, NO and PM in a major fine chemical industry park in the Yangtze River Delta of China detected by a sensor package on an unmanned aerial vehicle.利用无人机搭载的传感器包在中国长三角地区一个主要的精细化工产业园区内探测到的 O、NO 和 PM 的垂直分布情况。
Sci Total Environ. 2022 Nov 1;845:157113. doi: 10.1016/j.scitotenv.2022.157113. Epub 2022 Jul 1.
5
Impact of the COVID-19 on the vertical distributions of major pollutants from a tower in the Pearl River Delta.新冠疫情对珠江三角洲一座高塔主要污染物垂直分布的影响。
Atmos Environ (1994). 2022 May 1;276:119068. doi: 10.1016/j.atmosenv.2022.119068. Epub 2022 Mar 20.
6
Seasonal and vertical characteristics of particulate and elemental concentrations along diverse street canyons in South India.印度南部不同街道峡谷中颗粒物和元素浓度的季节及垂直特征。
Environ Sci Pollut Res Int. 2022 Dec;29(57):85883-85903. doi: 10.1007/s11356-021-15272-9. Epub 2021 Jul 8.
7
Source sector and fuel contributions to ambient PM and attributable mortality across multiple spatial scales.多空间尺度下,大气 PM 及其归因死亡的来源部门和燃料贡献。
Nat Commun. 2021 Jun 14;12(1):3594. doi: 10.1038/s41467-021-23853-y.
8
Critical supply chains for mitigating PM emission-related mortalities in India.印度缓解与 PM 排放相关的死亡的关键供应链。
Sci Rep. 2021 Jun 7;11(1):11914. doi: 10.1038/s41598-021-91438-2.
9
Cable-car measurements of vertical aerosol profiles impacted by mountain-valley breezes in Lushan Mountain, East China.庐山山谷风影响下的缆车测量垂直气溶胶廓线。
Sci Total Environ. 2021 May 10;768:144198. doi: 10.1016/j.scitotenv.2020.144198. Epub 2021 Jan 2.
10
Cardiovascular effects of air pollution: current evidence from animal and human studies.空气污染对心血管的影响:来自动物和人体研究的现有证据。
Am J Physiol Heart Circ Physiol. 2021 Apr 1;320(4):H1417-H1439. doi: 10.1152/ajpheart.00706.2020. Epub 2021 Jan 29.