• 文献检索
  • 文档翻译
  • 深度研究
  • 学术资讯
  • Suppr Zotero 插件Zotero 插件
  • 邀请有礼
  • 套餐&价格
  • 历史记录
应用&插件
Suppr Zotero 插件Zotero 插件浏览器插件Mac 客户端Windows 客户端微信小程序
定价
高级版会员购买积分包购买API积分包
服务
文献检索文档翻译深度研究API 文档MCP 服务
关于我们
关于 Suppr公司介绍联系我们用户协议隐私条款
关注我们

Suppr 超能文献

核心技术专利:CN118964589B侵权必究
粤ICP备2023148730 号-1Suppr @ 2026

文献检索

告别复杂PubMed语法,用中文像聊天一样搜索,搜遍4000万医学文献。AI智能推荐,让科研检索更轻松。

立即免费搜索

文件翻译

保留排版,准确专业,支持PDF/Word/PPT等文件格式,支持 12+语言互译。

免费翻译文档

深度研究

AI帮你快速写综述,25分钟生成高质量综述,智能提取关键信息,辅助科研写作。

立即免费体验

基于星载激光雷达结合机器学习模型和地统计方法的森林地上生物量估计

Forest aboveground biomass estimation based on spaceborne LiDAR combining machine learning model and geostatistical method.

作者信息

Xu Li, Yu Jinge, Shu Qingtai, Luo Shaolong, Zhou Wenwu, Duan Dandan

机构信息

Faculty of College of Soil and Water Conservation, Southwest Forestry University, Kunming, China.

Information Technology Research Center, Beijing Academy of Agriculture and Forestry Sciences, Beijing, China.

出版信息

Front Plant Sci. 2024 Dec 11;15:1428268. doi: 10.3389/fpls.2024.1428268. eCollection 2024.

DOI:10.3389/fpls.2024.1428268
PMID:39722875
原文链接:https://pmc.ncbi.nlm.nih.gov/articles/PMC11668607/
Abstract

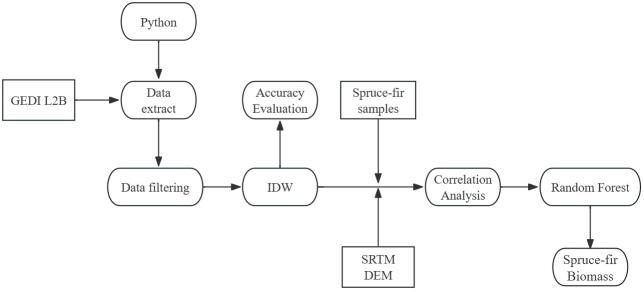
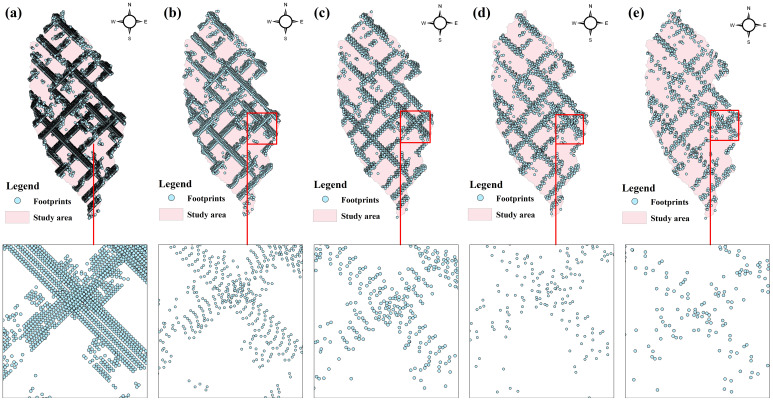
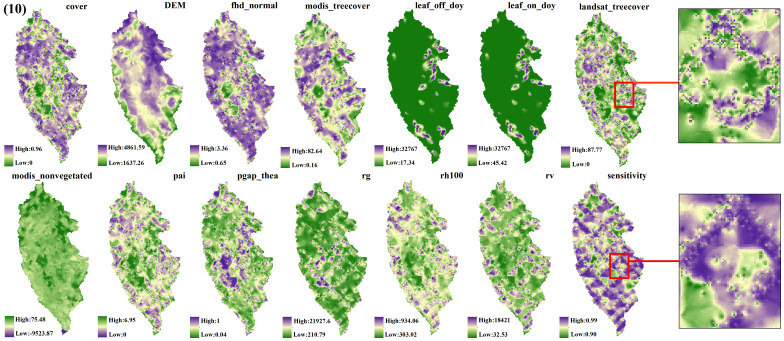
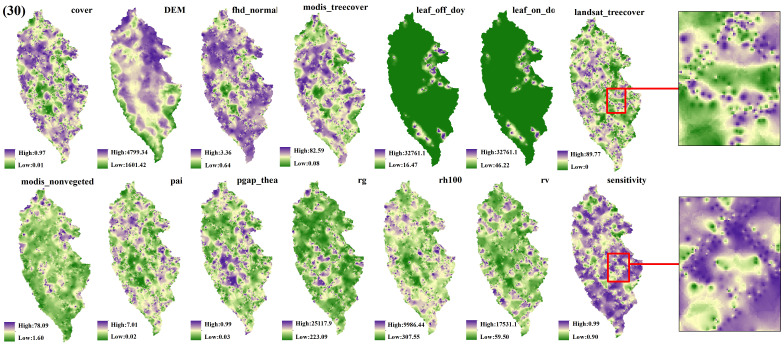
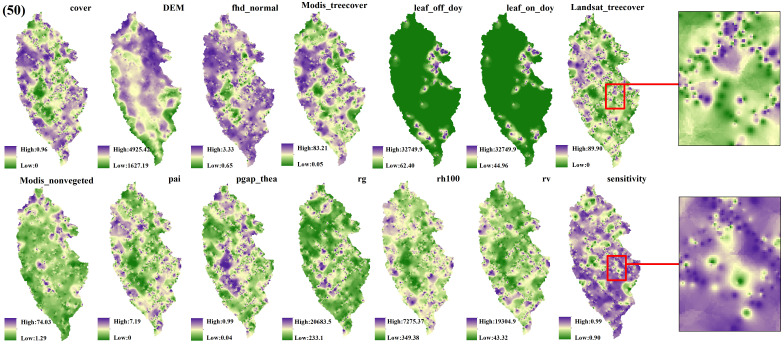
Estimation of forest biomass at regional scale based on GEDI spaceborne LiDAR data is of great significance for forest quality assessment and carbon cycle. To solve the problem of discontinuous data of GEDI footprints, this study mapped different echo indexes in the footprints to the surface by inverse distance weighted interpolation method, and verified the influence of different number of footprints on the interpolation results. Random forest algorithm was chosen to estimate the spruce-fir biomass combined with the parameters provided by GEDI and 138 spruce-fir sample plots in Shangri-La. The results show that: (1) By extracting different numbers of GEDI footprints and visualize it, the study revealed that a higher number of footprints correlates with a denser distribution and a more pronounced stripe phenomenon. (2) The prediction accuracy improves as the number of GEDI footprints decreases. The group with the highest R, lowest RMSE and lowest MAE was the footprint extracted every 100 shots, and the footprint extracted every 10 shots had the worst prediction effect. (3) The biomass of spruce-fir inverted by random forest ranged from 51.33 t/hm to 179.83 t/hm, with an average of 101.98 t/hm. The total value was 3035.29 × 10 t/hm. This study shows that the number and distribution of GEDI footprints will have a certain impact on the interpolation mapping to the surface information and presents a methodological reference for selecting the appropriate number of GEDI footprints to derive various vertical structure parameters of forest ecosystems.

摘要

基于GEDI星载激光雷达数据估算区域尺度森林生物量对森林质量评估和碳循环具有重要意义。为解决GEDI足迹数据不连续的问题,本研究采用反距离加权插值法将足迹中的不同回波指数映射到地表,并验证了不同数量足迹对插值结果的影响。结合GEDI提供的参数和香格里拉138个云杉-冷杉样地,选择随机森林算法估算云杉-冷杉生物量。结果表明:(1) 通过提取不同数量的GEDI足迹并进行可视化,研究发现足迹数量越多,分布越密集,条带现象越明显。(2) 随着GEDI足迹数量的减少,预测精度提高。相关系数R最高、均方根误差RMSE最低和平均绝对误差MAE最低的组是每100次发射提取的足迹,每10次发射提取的足迹预测效果最差。(3) 随机森林反演的云杉-冷杉生物量范围为51.33 t/hm至179.83 t/hm,平均为101.98 t/hm。总量为3035.29× $10^4$ t/hm。本研究表明,GEDI足迹的数量和分布对地表信息的插值制图会产生一定影响,并为选择合适数量的GEDI足迹以推导森林生态系统的各种垂直结构参数提供了方法参考。

https://cdn.ncbi.nlm.nih.gov/pmc/blobs/a5ab/11668607/7488993f43c4/fpls-15-1428268-g008.jpg
https://cdn.ncbi.nlm.nih.gov/pmc/blobs/a5ab/11668607/26a5d102e49a/fpls-15-1428268-g002.jpg
https://cdn.ncbi.nlm.nih.gov/pmc/blobs/a5ab/11668607/099307746ec4/fpls-15-1428268-g003.jpg
https://cdn.ncbi.nlm.nih.gov/pmc/blobs/a5ab/11668607/441e3d711a65/fpls-15-1428268-g004.jpg
https://cdn.ncbi.nlm.nih.gov/pmc/blobs/a5ab/11668607/6de1928669bd/fpls-15-1428268-g005.jpg
https://cdn.ncbi.nlm.nih.gov/pmc/blobs/a5ab/11668607/2e4268847257/fpls-15-1428268-g006.jpg
https://cdn.ncbi.nlm.nih.gov/pmc/blobs/a5ab/11668607/fb6bd36c7eed/fpls-15-1428268-g007.jpg
https://cdn.ncbi.nlm.nih.gov/pmc/blobs/a5ab/11668607/7488993f43c4/fpls-15-1428268-g008.jpg

相似文献

1
Forest aboveground biomass estimation based on spaceborne LiDAR combining machine learning model and geostatistical method.基于星载激光雷达结合机器学习模型和地统计方法的森林地上生物量估计
Front Plant Sci. 2024 Dec 11;15:1428268. doi: 10.3389/fpls.2024.1428268. eCollection 2024.
2
Calibration of GEDI footprint aboveground biomass models in Mediterranean forests with NFI plots: A comparison of approaches.利用国家森林资源清查(NFI)样地校准地中海森林中GEDI足迹地上生物量模型:方法比较
J Environ Manage. 2025 Feb;375:124313. doi: 10.1016/j.jenvman.2025.124313. Epub 2025 Jan 31.
3
Comparison of forest stand height interpolation of GEDI and ICESat-2 LiDAR measurements over tropical and sub-tropical forests in India.比较 GEDI 和 ICESat-2 激光雷达测量在印度热带和亚热带森林中林分高度的插值结果。
Environ Monit Assess. 2022 Nov 4;195(1):71. doi: 10.1007/s10661-022-10657-w.
4
Integrating GEDI and Landsat: Spaceborne Lidar and Four Decades of Optical Imagery for the Analysis of Forest Disturbances and Biomass Changes in Italy.将 GEDI 与 Landsat 相结合:星载激光雷达和四十年来的光学影像,用于分析意大利的森林干扰和生物量变化。
Sensors (Basel). 2022 Mar 4;22(5):2015. doi: 10.3390/s22052015.
5
Estimation of forest canopy closure in northwest Yunnan based on multi-source remote sensing data colla-boration.基于多源遥感数据融合的滇西北森林冠层闭合度估算。
Ying Yong Sheng Tai Xue Bao. 2023 Jul;34(7):1806-1816. doi: 10.13287/j.1001-9332.202307.021.
6
Integrating spaceborne LiDAR and Sentinel-2 images to estimate forest aboveground biomass in Northern China.整合星载激光雷达和哨兵-2号卫星图像以估算中国北方森林地上生物量。
Carbon Balance Manag. 2022 Sep 1;17(1):12. doi: 10.1186/s13021-022-00212-y.
7
LiDAR GEDI derived tree canopy height heterogeneity reveals patterns of biodiversity in forest ecosystems.基于激光雷达的GEDI数据得出的树冠高度异质性揭示了森林生态系统中的生物多样性模式。
Ecol Inform. 2023 Sep;76:102082. doi: 10.1016/j.ecoinf.2023.102082.
8
Estimation of Aboveground Biomass in Agroforestry Systems over Three Climatic Regions in West Africa Using Sentinel-1, Sentinel-2, ALOS, and GEDI Data.利用哨兵-1、哨兵-2、ALOS 和 GEDI 数据估算西非三个气候区农林复合系统的地上生物量。
Sensors (Basel). 2022 Dec 29;23(1):349. doi: 10.3390/s23010349.
9
Remote sensing estimation of aboveground biomass of different forest types in Xinjiang based on machine learning.基于机器学习的新疆不同森林类型地上生物量遥感估算
Sci Rep. 2025 Feb 20;15(1):6187. doi: 10.1038/s41598-025-90906-3.
10
Enhancing Wetland Mapping: Integrating Sentinel-1/2, GEDI Data, and Google Earth Engine.增强湿地测绘:整合哨兵-1/2、GEDI数据和谷歌地球引擎
Sensors (Basel). 2024 Mar 3;24(5):1651. doi: 10.3390/s24051651.

本文引用的文献

1
Estimation of Aboveground Biomass in Agroforestry Systems over Three Climatic Regions in West Africa Using Sentinel-1, Sentinel-2, ALOS, and GEDI Data.利用哨兵-1、哨兵-2、ALOS 和 GEDI 数据估算西非三个气候区农林复合系统的地上生物量。
Sensors (Basel). 2022 Dec 29;23(1):349. doi: 10.3390/s23010349.
2
Area-to-point regression Kriging approach fusion of Landsat 8 OLI and Sentinel 2 data for assessment of soil macronutrients at Anaimalai, Coimbatore.利用 Landsat 8 OLI 和 Sentinel 2 数据的面积-点回归克里金融合方法评估 Coimbatore 地区 Anaimalai 的土壤大量营养元素。
Environ Monit Assess. 2022 Oct 18;194(12):916. doi: 10.1007/s10661-022-10571-1.
3
Integrating GEDI and Landsat: Spaceborne Lidar and Four Decades of Optical Imagery for the Analysis of Forest Disturbances and Biomass Changes in Italy.
将 GEDI 与 Landsat 相结合:星载激光雷达和四十年来的光学影像,用于分析意大利的森林干扰和生物量变化。
Sensors (Basel). 2022 Mar 4;22(5):2015. doi: 10.3390/s22052015.
4
Individual Tree Segmentation Method Based on Mobile Backpack LiDAR Point Clouds.基于移动背包激光雷达点云的单木分割方法。
Sensors (Basel). 2021 Sep 8;21(18):6007. doi: 10.3390/s21186007.
5
Personalized prediction of transcranial magnetic stimulation clinical response in patients with treatment-refractory depression using neuroimaging biomarkers and machine learning.使用神经影像学生物标志物和机器学习对治疗抵抗性抑郁症患者进行经颅磁刺激临床反应的个体化预测。
J Affect Disord. 2021 Jul 1;290:261-271. doi: 10.1016/j.jad.2021.04.081. Epub 2021 May 16.
6
Estimating the aboveground biomass of coniferous forest in Northeast China using spectral variables, land surface temperature and soil moisture.利用光谱变量、地表温度和土壤湿度估算中国东北地区针叶林的地上生物量。
Sci Total Environ. 2021 Sep 1;785:147335. doi: 10.1016/j.scitotenv.2021.147335. Epub 2021 Apr 24.
7
Forest aboveground biomass estimation using Landsat 8 and Sentinel-1A data with machine learning algorithms.利用 Landsat 8 和 Sentinel-1A 数据与机器学习算法估算森林地上生物量。
Sci Rep. 2020 Jun 19;10(1):9952. doi: 10.1038/s41598-020-67024-3.
8
The Importance of Consistent Global Forest Aboveground Biomass Product Validation.全球森林地上生物量产品一致性验证的重要性。
Surv Geophys. 2019;40(4):979-999. doi: 10.1007/s10712-019-09538-8. Epub 2019 May 30.
9
[Additive aboveground biomass equations based on different predictors for natural Tilia Linn].基于不同预测因子的天然椴树地上生物量加法方程
Ying Yong Sheng Tai Xue Bao. 2018 Nov;29(11):3685-3695. doi: 10.13287/j.1001-9332.201811.020.