• 文献检索
  • 文档翻译
  • 深度研究
  • 学术资讯
  • Suppr Zotero 插件Zotero 插件
  • 邀请有礼
  • 套餐&价格
  • 历史记录
应用&插件
Suppr Zotero 插件Zotero 插件浏览器插件Mac 客户端Windows 客户端微信小程序
定价
高级版会员购买积分包购买API积分包
服务
文献检索文档翻译深度研究API 文档MCP 服务
关于我们
关于 Suppr公司介绍联系我们用户协议隐私条款
关注我们

Suppr 超能文献

核心技术专利:CN118964589B侵权必究
粤ICP备2023148730 号-1Suppr @ 2026

文献检索

告别复杂PubMed语法,用中文像聊天一样搜索,搜遍4000万医学文献。AI智能推荐,让科研检索更轻松。

立即免费搜索

文件翻译

保留排版,准确专业,支持PDF/Word/PPT等文件格式,支持 12+语言互译。

免费翻译文档

深度研究

AI帮你快速写综述,25分钟生成高质量综述,智能提取关键信息,辅助科研写作。

立即免费体验

利用哨兵1A合成孔径雷达(SAR)数据进行时间序列分析,以获取年度水稻种植面积图和季节开始的长期动态变化。

Time series analysis of Sentinel 1 A SAR data to retrieve annual rice area maps and long-term dynamics of start of season.

作者信息

Sellaperumal Pazhanivelan, Kaliaperumal Ragunath, Dhanaraju Muthumanickam, N S Sudarmanian, P Shanmugapriya, S Satheesh, Singaram Manikandan, A P Sivamurugan, Marimuthu Raju, Rangasamy Baskaran, R Tamilmounika

机构信息

Centre for Water and Geospatial Studies, Tamil Nadu Agricultural University, Coimbatore, 641003, India.

Department of Remote Sensing and GIS, Tamil Nadu Agricultural University, Coimbatore, 641003, India.

出版信息

Sci Rep. 2025 Mar 10;15(1):8202. doi: 10.1038/s41598-025-91655-z.

DOI:10.1038/s41598-025-91655-z
PMID:40064938
原文链接:https://pmc.ncbi.nlm.nih.gov/articles/PMC11894211/
Abstract

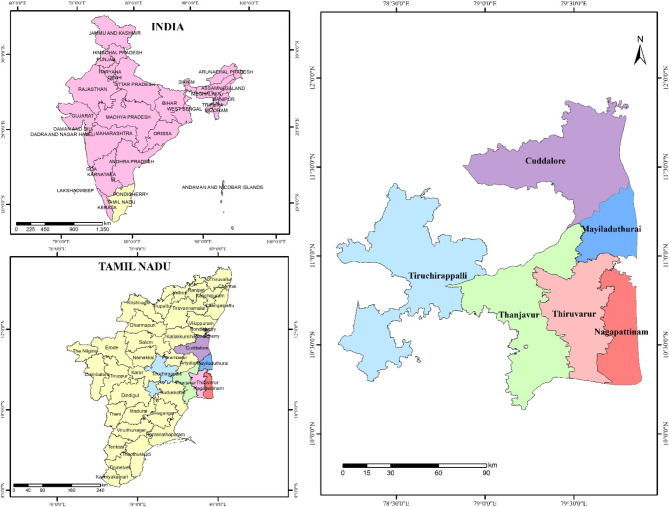
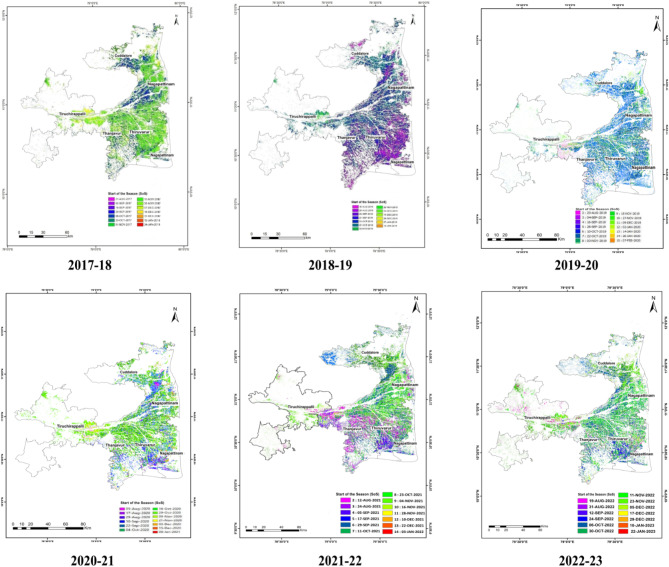
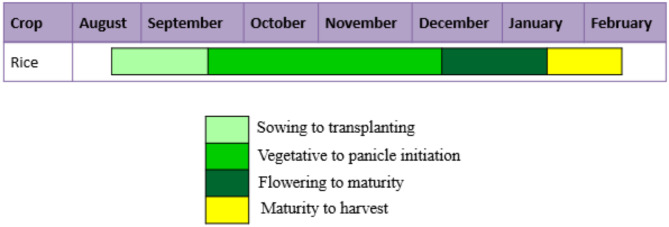
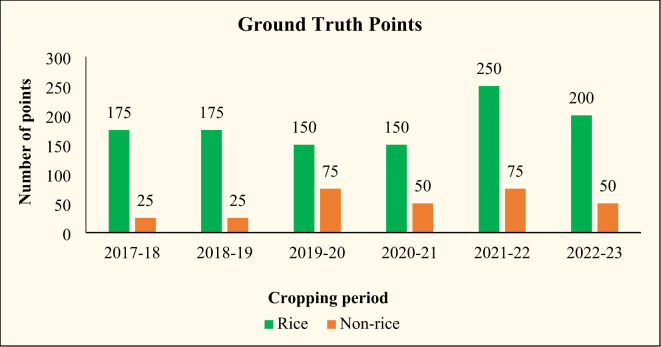
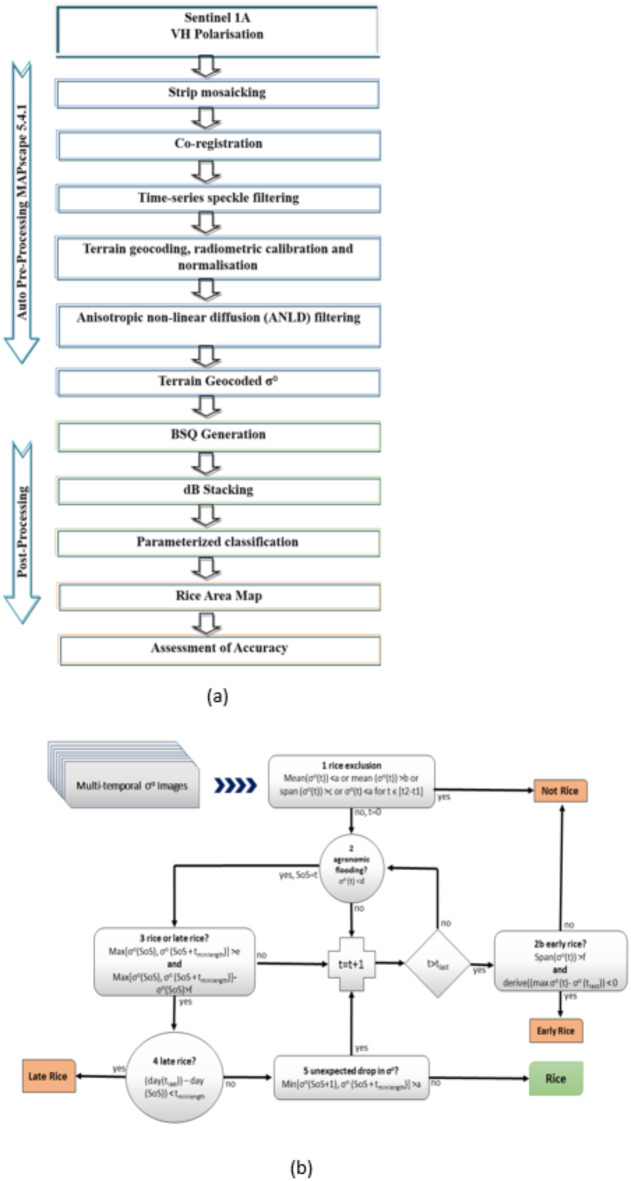
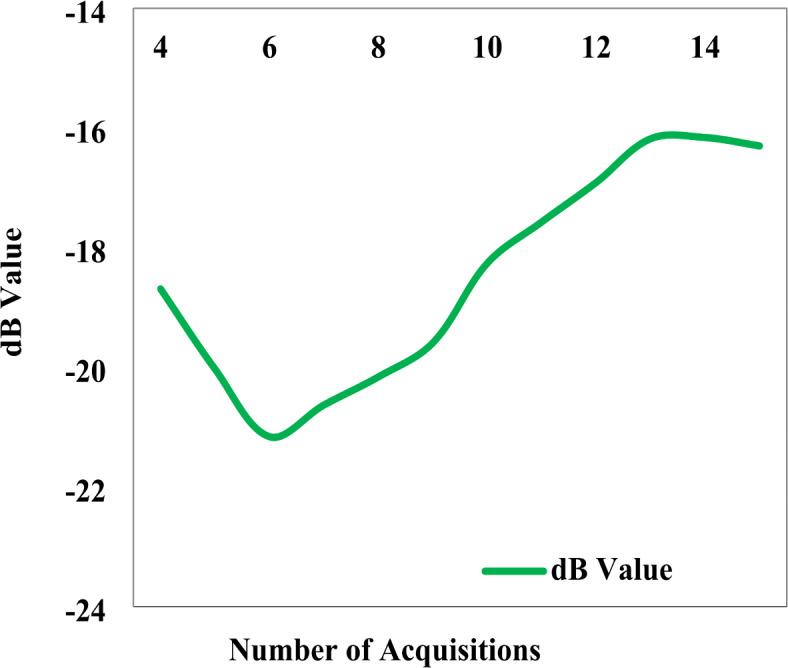
Rice is a vital staple crop globally, and accurate estimation of rice area was crucial for effective agricultural management and food security. Synthetic Aperture Radar (SAR) data has emerged as a valuable remote sensing tool for rice area estimation due to its ability to penetrate cloud cover and capture backscattered signals from rice fields. The backscatter signature of rice showed a minimum dB value at agronomic flooding indicating the Start of Season (SoS). The parameters viz., the minimum values of -22.03 to -17.69 dB at the start of season, maximum value of -16.10 to -14.20 dB at the peak of season coinciding with heading and corresponding mean increase of 5.07 dB during growing stages were utilized for developing rule-based classification system. Rice area was estimated over the Cauvery Delta Zone of Tamil Nadu, India for the past six years during samba (August-January) season from 2017 to 2023 using Sentinel 1 A Synthetic Aperture Radar satellite data. Rice area maps were generated for the region utilizing parameterization with a classification accuracy of 88.5 to 94.5 per cent with a kappa score of 0.77 to 0.87 during the study period. The total classified rice area during samba season in the Cauvery Delta Zone was 508,581 ha, 456,601 ha, 506,844 ha, 511,714 ha, 524,723 ha and 476,586 ha for the years 2017-18 to 2022-23, respectively. The Start of Season (SoS) maps for samba season revealed that the major planting periods for rice were between the second fortnight of September to first fortnight of November in all the years except 2018 when early planting happened during the first fortnight of September due to favorable weather conditions and assured water supply. Near real-time information on rice area, start of season, and progress of planting derived using SAR satellite data will facilitate the development of decision support systems for sustaining the productivity of rice-based ecosystems.

摘要

水稻是全球重要的主食作物,准确估算水稻种植面积对于有效的农业管理和粮食安全至关重要。合成孔径雷达(SAR)数据因其能够穿透云层并捕捉稻田的后向散射信号,已成为估算水稻种植面积的一种有价值的遥感工具。水稻的后向散射特征在农艺淹水时显示出最低分贝值,表明季节开始(SoS)。利用季节开始时-22.03至-17.69分贝的最小值、与抽穗期一致的季节高峰期-16.10至-14.20分贝的最大值以及生长阶段相应的平均增加5.07分贝等参数,开发了基于规则的分类系统。利用哨兵1A合成孔径雷达卫星数据,对印度泰米尔纳德邦的科韦里三角洲地区在过去六年(从2017年到2023年)的桑巴(8月至1月)季节的水稻种植面积进行了估算。利用参数化方法为该地区生成了水稻种植面积图,在研究期间分类精度为88.5%至94.5%,卡帕系数为0.77至0.87。在2017 - 18年至2022 - 23年期间,科韦里三角洲地区桑巴季节的总分类水稻种植面积分别为508,581公顷、456,601公顷、506,844公顷、511,714公顷、524,723公顷和476,586公顷。桑巴季节的季节开始(SoS)图显示,除2018年外,所有年份水稻的主要种植期都在9月的第二个两周至11月的第一个两周之间,2018年由于天气有利和有保障的供水,在9月的第一个两周进行了早播。利用SAR卫星数据得出的关于水稻种植面积、季节开始和种植进度的近实时信息,将有助于开发决策支持系统,以维持水稻生态系统的生产力。

https://cdn.ncbi.nlm.nih.gov/pmc/blobs/cd9c/11894211/0eff38017aa9/41598_2025_91655_Fig8_HTML.jpg
https://cdn.ncbi.nlm.nih.gov/pmc/blobs/cd9c/11894211/fe76d9d2abaf/41598_2025_91655_Fig1_HTML.jpg
https://cdn.ncbi.nlm.nih.gov/pmc/blobs/cd9c/11894211/f9e2db682fcc/41598_2025_91655_Fig2_HTML.jpg
https://cdn.ncbi.nlm.nih.gov/pmc/blobs/cd9c/11894211/8120d5b2c4eb/41598_2025_91655_Fig3_HTML.jpg
https://cdn.ncbi.nlm.nih.gov/pmc/blobs/cd9c/11894211/027ffe119c60/41598_2025_91655_Fig4_HTML.jpg
https://cdn.ncbi.nlm.nih.gov/pmc/blobs/cd9c/11894211/0e8b721ca888/41598_2025_91655_Fig5_HTML.jpg
https://cdn.ncbi.nlm.nih.gov/pmc/blobs/cd9c/11894211/0a30f2366c6f/41598_2025_91655_Fig6_HTML.jpg
https://cdn.ncbi.nlm.nih.gov/pmc/blobs/cd9c/11894211/21c89cb07409/41598_2025_91655_Fig7_HTML.jpg
https://cdn.ncbi.nlm.nih.gov/pmc/blobs/cd9c/11894211/0eff38017aa9/41598_2025_91655_Fig8_HTML.jpg

相似文献

1
Time series analysis of Sentinel 1 A SAR data to retrieve annual rice area maps and long-term dynamics of start of season.利用哨兵1A合成孔径雷达(SAR)数据进行时间序列分析,以获取年度水稻种植面积图和季节开始的长期动态变化。
Sci Rep. 2025 Mar 10;15(1):8202. doi: 10.1038/s41598-025-91655-z.
2
Integrating Sentinel-1 data and machine learning for effective paddy field monitoring in Cauvery Delta Zone, Tamil Nadu, India.整合哨兵-1数据与机器学习以对印度泰米尔纳德邦高韦里河三角洲地区的稻田进行有效监测。
Environ Monit Assess. 2024 Dec 5;197(1):23. doi: 10.1007/s10661-024-13487-0.
3
Automated in-season rice crop mapping using Sentinel time-series data and Google Earth Engine: A case study in climate-risk prone Bangladesh.利用哨兵时间序列数据和谷歌地球引擎进行水稻作物生长季自动化制图:以气候风险高发的孟加拉国为例
J Environ Manage. 2024 Feb;351:119615. doi: 10.1016/j.jenvman.2023.119615. Epub 2023 Dec 12.
4
Rice yield prediction through integration of biophysical parameters with SAR and optical remote sensing data using machine learning models.利用机器学习模型,通过将生物物理参数与 SAR 和光学遥感数据相结合进行水稻产量预测。
Sci Rep. 2024 Sep 17;14(1):21674. doi: 10.1038/s41598-024-72624-4.
5
Radar versus optical: The impact of cloud cover when mapping seasonal surface water for health applications in monsoon-affected India.雷达与光学:在受季风影响的印度绘制用于健康应用的季节性地表水时云层覆盖的影响。
PLoS One. 2025 Jan 24;20(1):e0314033. doi: 10.1371/journal.pone.0314033. eCollection 2025.
6
Using of Multi-Source and Multi-Temporal Remote Sensing Data Improves Crop-Type Mapping in the Subtropical Agriculture Region.多源多时相遥感数据的使用提高了亚热带农业区的作物类型制图精度。
Sensors (Basel). 2019 May 26;19(10):2401. doi: 10.3390/s19102401.
7
Crop and varietal diversification of rainfed rice based cropping systems for higher productivity and profitability in Eastern India.为提高印度东部雨养水稻种植系统的生产力和盈利能力而进行的作物和品种多样化
PLoS One. 2017 Apr 24;12(4):e0175709. doi: 10.1371/journal.pone.0175709. eCollection 2017.
8
Exploring potential of C band synthetic aperture radar imagery to investigate rice crop growth mechanism and productivity.利用 C 波段合成孔径雷达图像探索研究水稻作物生长机制和生产力的潜力。
Environ Sci Pollut Res Int. 2021 Aug;28(31):42001-42013. doi: 10.1007/s11356-021-13759-z. Epub 2021 Apr 1.
9
Monitoring early-season agricultural drought using temporal Sentinel-1 SAR-based combined drought index.利用基于时间的 Sentinel-1 SAR 的综合干旱指数监测农业旱情。
Environ Monit Assess. 2023 Jul 7;195(8):925. doi: 10.1007/s10661-023-11524-y.
10
Spatiotemporal patterns of paddy rice croplands in China and India from 2000 to 2015.2000-2015 年中国和印度水稻种植区的时空格局。
Sci Total Environ. 2017 Feb 1;579:82-92. doi: 10.1016/j.scitotenv.2016.10.223. Epub 2016 Nov 17.

引用本文的文献

1
Research on Crop Classification Using U-Net Integrated with Multimodal Remote Sensing Temporal Features.基于U-Net融合多模态遥感时间特征的作物分类研究
Sensors (Basel). 2025 Aug 13;25(16):5005. doi: 10.3390/s25165005.

本文引用的文献

1
Exploring the use of Sentinel-2 datasets and environmental variables to model wheat crop yield in smallholder arid and semi-arid farming systems.利用 Sentinel-2 数据集和环境变量模型模拟小农干旱和半干旱农业系统中的小麦作物产量。
Sci Total Environ. 2023 Apr 15;869:161716. doi: 10.1016/j.scitotenv.2023.161716. Epub 2023 Jan 20.