Darabi Hatef, Galanis Ilias, Benzi Federico, Puiggalí Gerard Farré, Gerlee Philip, Lundh Torbjörn, Brouwers Lisa
The Public Health Agency of Sweden, Solna, 171 82, Sweden.
Mathematical Sciences, Chalmers University of Technology and University of Gothenburg, Gothenburg, 412 96, Sweden.
Sci Rep. 2025 Jul 2;15(1):23653. doi: 10.1038/s41598-025-08682-z.
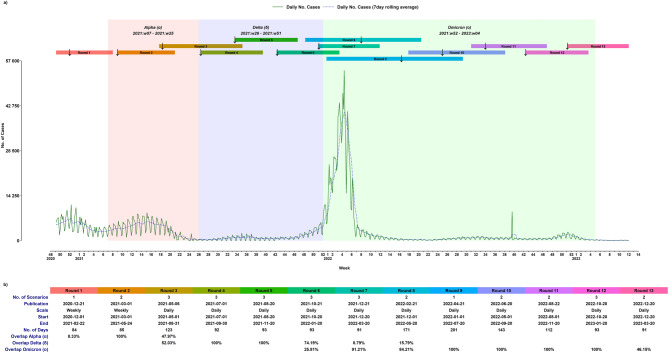
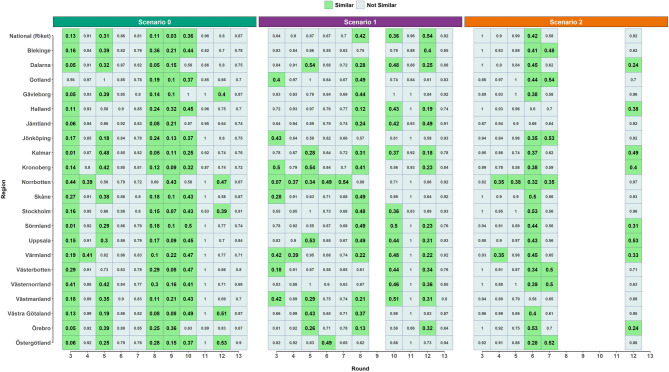
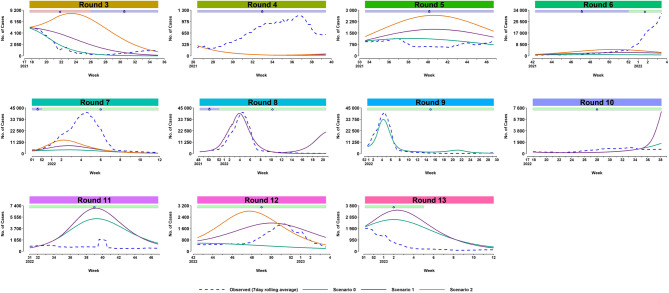
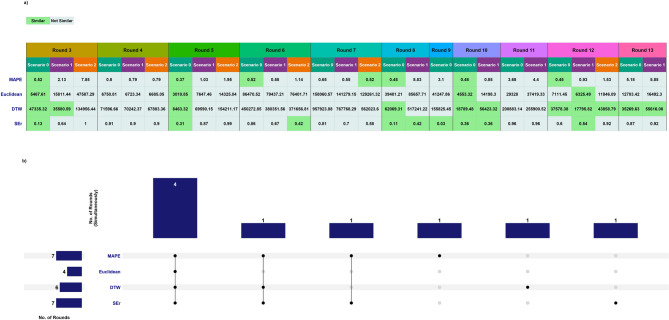
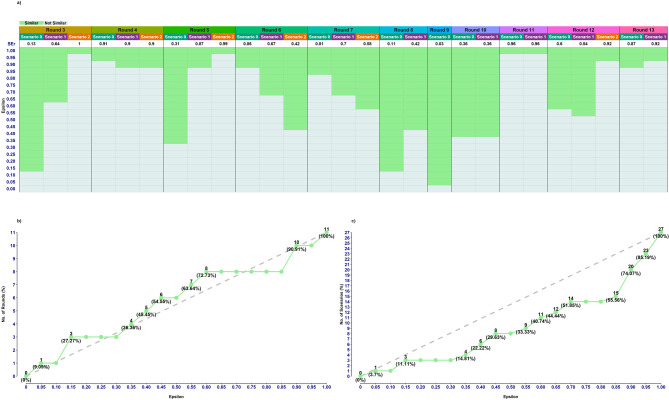
This study assesses the accuracy of COVID-19 scenarios for new infections produced by the Swedish Public Health Agency (PHAS) from December 1, 2020, to March 20, 2023. We introduce a Similarity Error ([Formula: see text]), which evaluates the dissimilarity between simulated and observed case time series using the following attributes: area under the curves, peak timings, and growth/decline rates before and after peaks. Rather than using an arbitrary cut-off, we used a threshold determined through Receiver Operating Characteristic (ROC) analysis, with performance evaluated using the Area Under the Curve (AUC), based on true positives identified by visual inspection for categorization. To further evaluate [Formula: see text]'s effectiveness, we conducted a sensitivity analysis across the full range of possible threshold values within the unit interval. Applying [Formula: see text] with an optimal threshold determined through ROC-analysis 7 rounds out of 11 rounds were classified as having one or more similar scenarios, including the 6 rounds identified by visual inspection. Our findings indicate that, despite the challenges of a rapidly evolving epidemic, PHAS delivered simulations that reflected real-world trends in most of the rounds.
本研究评估了瑞典公共卫生局(PHAS)在2020年12月1日至2023年3月20日期间生成的新冠病毒新感染情况预测的准确性。我们引入了一种相似性误差([公式:见正文]),该误差使用以下属性评估模拟病例时间序列与观察到的病例时间序列之间的差异:曲线下面积、峰值时间以及峰值前后的增长/下降速率。我们并非使用任意的截止值,而是使用通过接受者操作特征(ROC)分析确定的阈值,并基于通过目视检查确定的真阳性进行分类,使用曲线下面积(AUC)评估性能。为了进一步评估[公式:见正文]的有效性,我们在单位区间内所有可能的阈值范围内进行了敏感性分析。应用通过ROC分析确定的最优阈值的[公式:见正文],11轮中有7轮被归类为具有一个或多个相似情况,其中包括通过目视检查确定的6轮。我们的研究结果表明,尽管疫情快速演变带来挑战,但PHAS在大多数轮次中提供的模拟反映了现实世界的趋势。