Corbett Jonathan, Kraja Aldi, Borecki Ingrid B, Province Michael A
Division of Biostatistics, Washington University School of Medicine, 660 South Euclid Avenue, St. Louis, Missouri, USA.
BMC Genet. 2003 Dec 31;4 Suppl 1(Suppl 1):S5. doi: 10.1186/1471-2156-4-S1-S5.
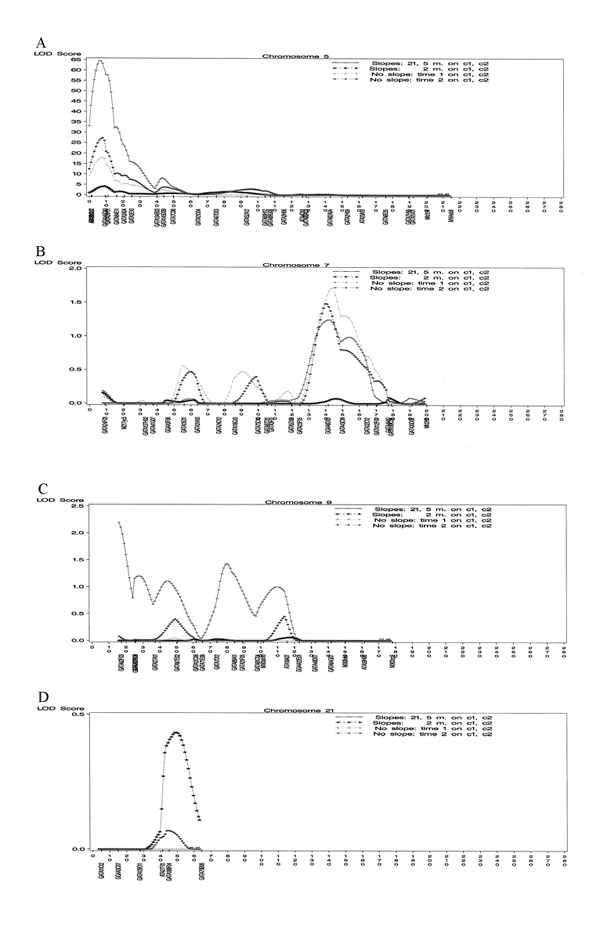
We used a random coefficient regression (RCR) model to estimate growth parameters for the time series of observed serum glucose levels in the Replicate 1 of the Genetic Analysis Workshop 13 simulated data. For comparison, a two time-point interval was also selected and the slope between these two observations was calculated. This process yielded four phenotypes: the RCR growth phenotype, a two time-point slope phenotype, and Time 1 and Time 2 serum glucose level phenotypes. These four phenotypes were used for linkage analyses on simulated chromosomes 5, 7, 9, and 21, those chromosomes that contained loci affecting the growth course for serum glucose levels. The linkage analysis of the RCR-derived phenotype showed overwhelming evidence for linkage at one locus (LOD 65.78 on chromosome 5), while showing elevated but nonsignificant LOD scores for two other loci (LOD 1.25 on chromosome 7, LOD 1.10 on chromosome 9), and no evidence of linkage for the final locus. The two time-point slope phenotype showed evidence for linkage at one locus (LOD 4.16 on chromosome 5) but no evidence for linkage at any of the other loci. A parallel cross-sectional approach, using as input phenotypes the endpoints of the two-point slope phenotype, gave strong linkage results for the major locus on chromosome 5 (maximal LOD scores of 17.90 and 27.24 for Time 1 and Time 2, respectively) while showing elevated but nonsignificant linkage results on chromosome 7 (maximal LOD scores of 1.71 and 1.48) and no evidence for linkage at the two remaining loci. The RCR growth parameter showed more power to detect linkage to the major locus than either the cross-sectional or two-point slope approach, but the cross-sectional approach gave a higher maximal LOD score for one of the minor loci.
我们使用随机系数回归(RCR)模型来估计遗传分析研讨会13模拟数据中重复1的观察血清葡萄糖水平时间序列的生长参数。为了进行比较,还选择了一个两个时间点的间隔,并计算这两个观察值之间的斜率。这个过程产生了四种表型:RCR生长表型、两个时间点斜率表型以及时间1和时间2血清葡萄糖水平表型。这四种表型用于对模拟的5号、7号、9号和21号染色体进行连锁分析,这些染色体包含影响血清葡萄糖水平生长过程的基因座。对RCR衍生表型的连锁分析显示,在一个基因座上有压倒性的连锁证据(5号染色体上的LOD为65.78),而在另外两个基因座上显示出升高但不显著的LOD分数(7号染色体上的LOD为1.25,9号染色体上的LOD为1.10),并且在最后一个基因座上没有连锁证据。两个时间点斜率表型在一个基因座上显示出连锁证据(5号染色体上的LOD为4.16),但在任何其他基因座上都没有连锁证据。一种平行的横断面方法,将两个时间点斜率表型的端点用作输入表型,在5号染色体上的主要基因座上给出了很强的连锁结果(时间1和时间2的最大LOD分数分别为17.90和27.24),而在7号染色体上显示出升高但不显著的连锁结果(最大LOD分数为1.71和1.48),并且在其余两个基因座上没有连锁证据。RCR生长参数在检测与主要基因座的连锁方面比横断面或两点斜率方法更有能力,但横断面方法在一个次要基因座上给出了更高的最大LOD分数。