Department of Epidemiology, University of Washington, School of Public Health and Community Medicine, Seattle, WA, USA.
BMC Genet. 2005 Dec 30;6 Suppl 1(Suppl 1):S5. doi: 10.1186/1471-2156-6-S1-S5.
The feasibility of effectively analyzing high-density single nucleotide polymorphism (SNP) maps in whole genome scans of complex traits is not known. The purpose of this study was to compare variance components linkage results using different density marker maps in data from the Collaborative Study on the Genetics of Alcoholism (COGA). Marker maps having an average spacing of 10 cM (microsatellite), 0.78 cM (SNP1), and 0.31 cM (SNP2) were used to identify quantitative trait loci (QTLs) affecting maximum number of alcoholic drinks consumed in a 24-hour period (Inmaxalc).
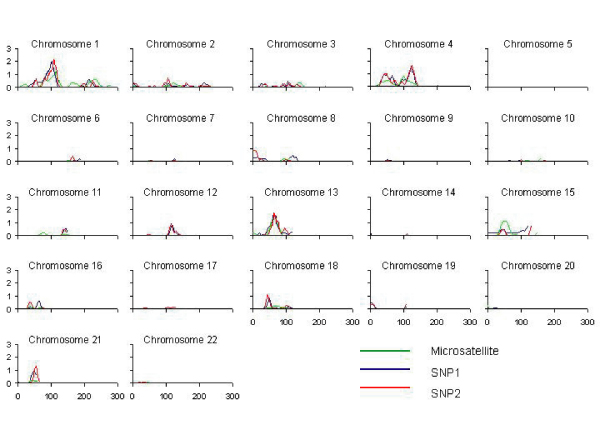
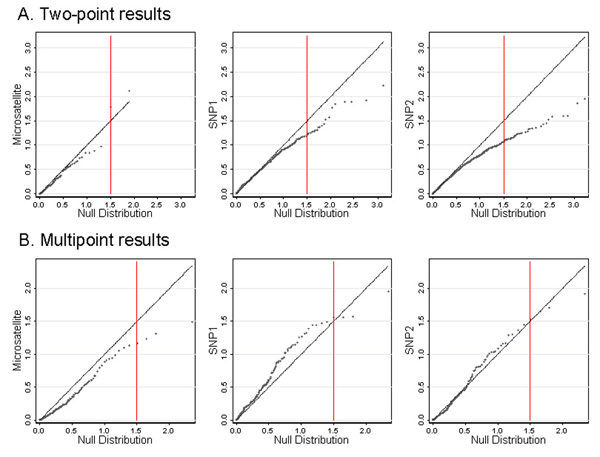
Heritability of Inmaxalc was estimated to be 15%. Multipoint variance components linkage analysis revealed similar linkage patterns among the three marker panels, with the SNP maps consistently yielding higher LOD scores. Robust LOD scores > 1.0 were observed on chromosomes 1 and 13 for all three marker maps. Additional LODs > 1.0 were observed on chromosome 4 with both SNP maps and on chromosomes 18 and 21 with the SNP2 map. Peak LOD scores for Inmaxalc were observed on chromosome 1, although none reached genome-wide statistical significance. Quantile-quantile plots revealed that the multipoint distribution of SNP results appeared to fit the asymptotic null distribution better than the twopoint results.
In conclusion, variance-components linkage analysis using high-density SNP maps provided higher LOD scores compared with the standard microsatellite map, similar to studies using nonparametric linkage methods. Widespread application of SNP maps will depend on further improvements in the computational methods implemented in current software packages.
目前尚不清楚在复杂性状的全基因组扫描中,有效分析高密度单核苷酸多态性(SNP)图谱的可行性。本研究的目的是比较使用不同密度标记图谱的方差分量连锁分析结果,这些数据来自酒精遗传合作研究(COGA)。使用平均间距为 10cM(微卫星)、0.78cM(SNP1)和 0.31cM(SNP2)的标记图谱来识别影响 24 小时内最大饮酒量的数量性状基因座(QTL)。
Inmaxalc 的遗传率估计为 15%。多点方差分量连锁分析显示,三种标记面板之间存在相似的连锁模式,SNP 图谱始终产生更高的 LOD 分数。三种标记图谱均在染色体 1 和 13 上观察到稳健的 LOD 分数>1.0,并且在 SNP 图谱和 SNP2 图谱上均在染色体 4 和 18、21 上观察到额外的 LOD>1.0。Inmaxalc 的峰值 LOD 分数出现在染色体 1 上,尽管没有一个达到全基因组统计学意义。分位数-分位数图显示,SNP 结果的多点分布似乎比两点结果更符合渐近零分布。
总之,使用高密度 SNP 图谱的方差分量连锁分析与使用非参数连锁方法的研究相比,提供了更高的 LOD 分数。SNP 图谱的广泛应用将取决于当前软件包中实施的计算方法的进一步改进。