• 文献检索
  • 文档翻译
  • 深度研究
  • 学术资讯
  • Suppr Zotero 插件Zotero 插件
  • 邀请有礼
  • 套餐&价格
  • 历史记录
应用&插件
Suppr Zotero 插件Zotero 插件浏览器插件Mac 客户端Windows 客户端微信小程序
定价
高级版会员购买积分包购买API积分包
服务
文献检索文档翻译深度研究API 文档MCP 服务
关于我们
关于 Suppr公司介绍联系我们用户协议隐私条款
关注我们

Suppr 超能文献

核心技术专利:CN118964589B侵权必究
粤ICP备2023148730 号-1Suppr @ 2026

文献检索

告别复杂PubMed语法,用中文像聊天一样搜索,搜遍4000万医学文献。AI智能推荐,让科研检索更轻松。

立即免费搜索

文件翻译

保留排版,准确专业,支持PDF/Word/PPT等文件格式,支持 12+语言互译。

免费翻译文档

深度研究

AI帮你快速写综述,25分钟生成高质量综述,智能提取关键信息,辅助科研写作。

立即免费体验

识别疾病高发的地理区域:发病率的置信区间与疾病聚集性检测方法何时一致?

Identifying geographic areas with high disease rates: when do confidence intervals for rates and a disease cluster detection method agree?

作者信息

Rosychuk Rhonda J

机构信息

Department of Pediatrics, University of Alberta, 9423 Aberhart Centre, Edmonton, Alberta, Canada.

出版信息

Int J Health Geogr. 2006 Oct 18;5:46. doi: 10.1186/1476-072X-5-46.

DOI:10.1186/1476-072X-5-46
PMID:17049097
原文链接:https://pmc.ncbi.nlm.nih.gov/articles/PMC1630694/
Abstract

BACKGROUND

Geographic regions are often routinely monitored to identify areas with excess cases of disease. Further epidemiological investigations can be targeted to areas with higher disease rates than expected. Surveillance strategies typically include the calculation of sub-regional rates, and their associated confidence intervals, that are compared with the rate of the entire geographic region. More sophisticated approaches use disease cluster detection methods that require specialized software. These approaches are not the same but may lead to similar results in specific situations. A natural question arises as to when these different approaches lead to the same conclusions. We compare the Besag and Newell 1 cluster detection method, suitable for geographic areas with diverse population sizes, with confidence intervals for crude and directly standardized rates. The cluster detection method tests each area at a pre-specified cluster size. Conditions when these methods agree and disagree are provided. We use a dataset on self-inflicted injuries requiring medical attention as an illustration and give power comparisons for a variety of situations.

RESULTS

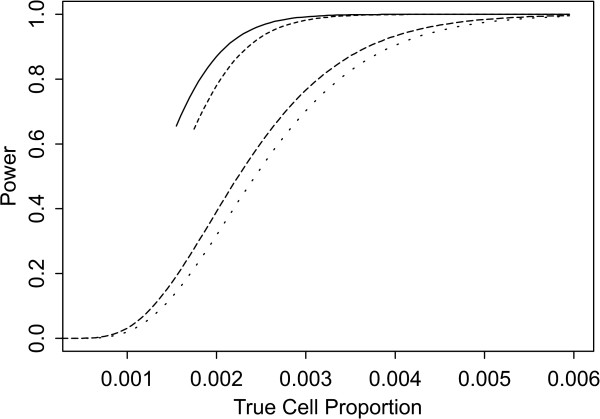
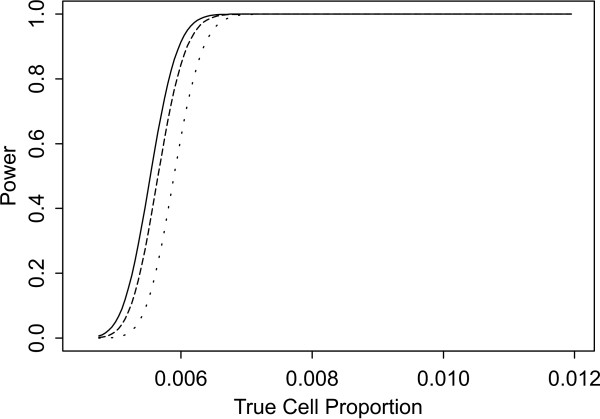
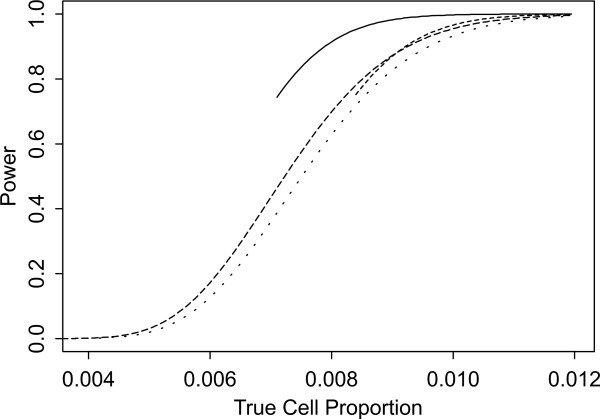
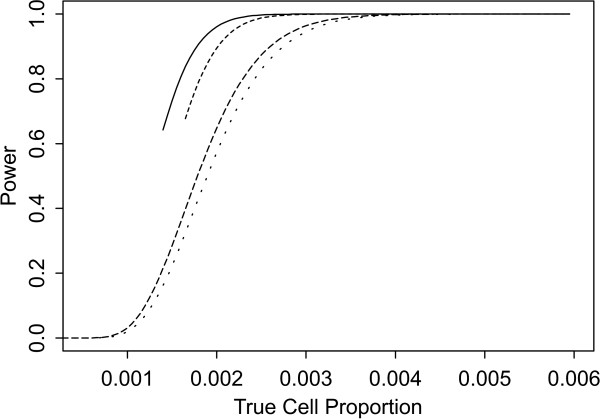
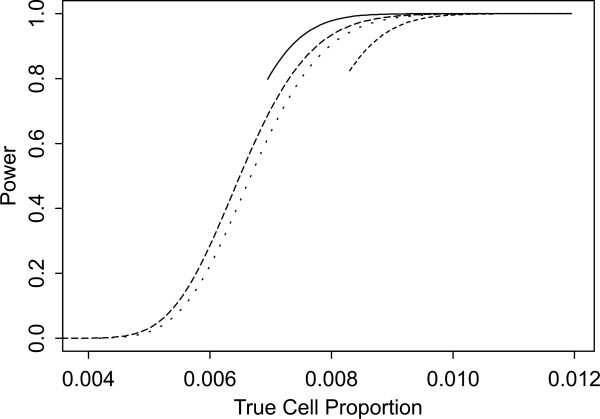
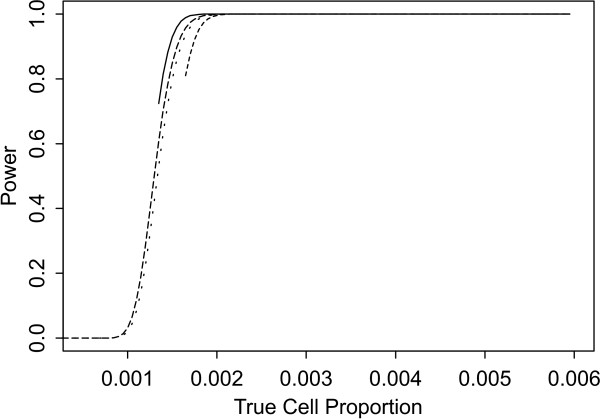
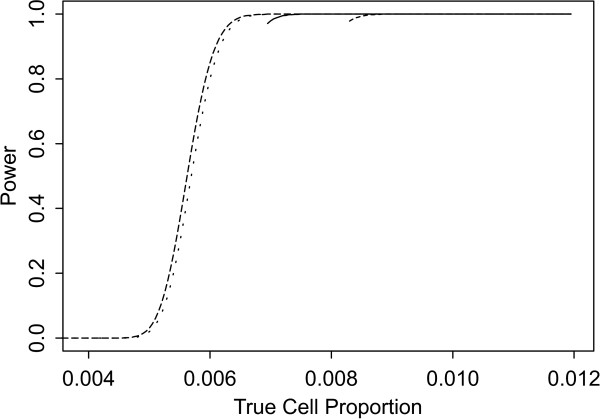
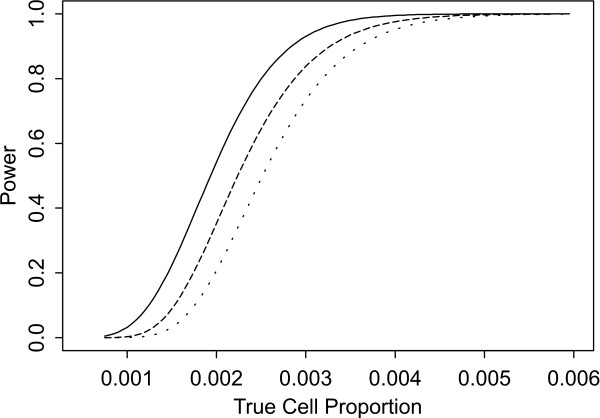
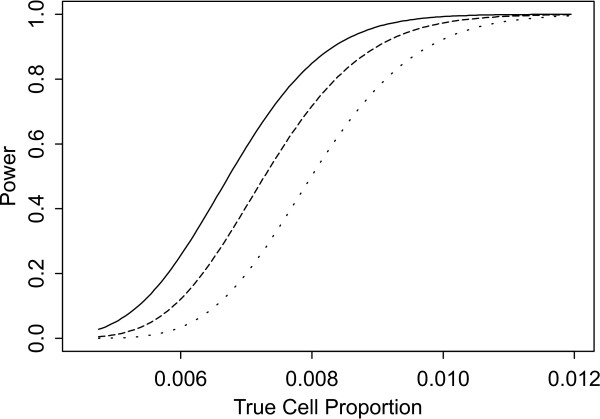
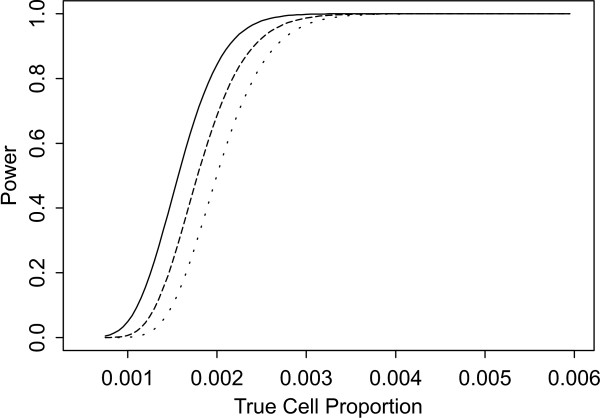
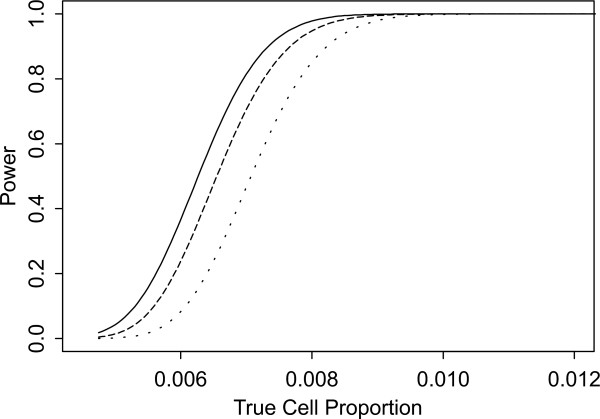
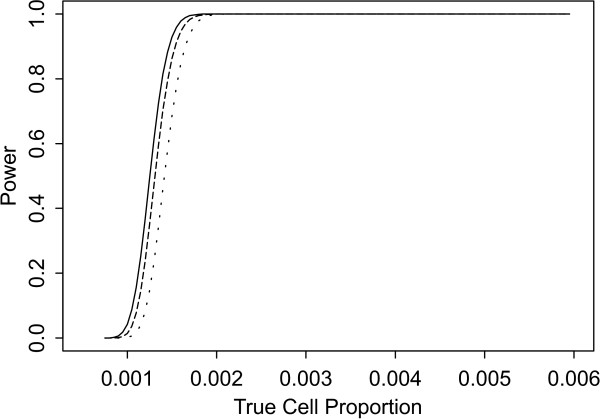
Three conditions must be satisfied for the confidence interval and cluster detection methods to both provide statistically significant higher rates for an individual administrative area. These criteria are based on observed and expected cases above specific thresholds. In our dataset, two areas are significant with both methods and one additional area is identified with the cluster detection method. Power comparisons for different scenarios suggest that the methods have similar power for detecting rates that are twice as large as the overall rate and when the overall rate and sample sizes are not too small. The cluster detection method has better power when the size of the cluster is relatively small.

CONCLUSION

The cluster size plays a key role in the comparability of methods. The cluster detection method is preferred when the cluster size exceeds the number of cases in an administrative area or when the expected number of cases exceeds a threshold.

摘要

背景

通常会对地理区域进行常规监测,以识别疾病病例过多的地区。进一步的流行病学调查可针对疾病发生率高于预期的地区。监测策略通常包括计算次区域发病率及其相关的置信区间,并将其与整个地理区域的发病率进行比较。更复杂的方法使用需要专门软件的疾病聚集性检测方法。这些方法并不相同,但在特定情况下可能会得出相似的结果。一个自然的问题是,这些不同的方法何时会得出相同的结论。我们将适用于人口规模各异的地理区域的贝萨格和纽厄尔1聚集性检测方法与粗发病率和直接标准化发病率的置信区间进行比较。聚集性检测方法会在预先指定的聚集规模下对每个区域进行检测。给出了这些方法一致和不一致的条件。我们以需要医疗救治的自残伤害数据集为例进行说明,并给出了各种情况下的效能比较。

结果

要使置信区间和聚集性检测方法都为单个行政区提供具有统计学意义的更高发病率,必须满足三个条件。这些标准基于高于特定阈值的观察到的和预期的病例数。在我们的数据集中,两种方法都显示有两个区域具有显著性,并且聚集性检测方法还识别出了另外一个区域。不同场景下的效能比较表明,对于检测出的发病率是总体发病率两倍的情况,以及总体发病率和样本量都不太小的情况,这两种方法具有相似的效能。当聚集规模相对较小时用聚集性检测方法的效能更好。

结论

聚集规模在方法的可比性中起着关键作用。当聚集规模超过一个行政区的病例数或预期病例数超过阈值时,聚集性检测方法更可取。

https://cdn.ncbi.nlm.nih.gov/pmc/blobs/f545/1630694/60e8708b8158/1476-072X-5-46-12.jpg
https://cdn.ncbi.nlm.nih.gov/pmc/blobs/f545/1630694/1e99a173d7e4/1476-072X-5-46-1.jpg
https://cdn.ncbi.nlm.nih.gov/pmc/blobs/f545/1630694/8fac73dc2193/1476-072X-5-46-2.jpg
https://cdn.ncbi.nlm.nih.gov/pmc/blobs/f545/1630694/bd2cad95a129/1476-072X-5-46-3.jpg
https://cdn.ncbi.nlm.nih.gov/pmc/blobs/f545/1630694/d1cfb915e22e/1476-072X-5-46-4.jpg
https://cdn.ncbi.nlm.nih.gov/pmc/blobs/f545/1630694/dc6d2deeef17/1476-072X-5-46-5.jpg
https://cdn.ncbi.nlm.nih.gov/pmc/blobs/f545/1630694/cd1396c865fe/1476-072X-5-46-6.jpg
https://cdn.ncbi.nlm.nih.gov/pmc/blobs/f545/1630694/b45ef7f93ad2/1476-072X-5-46-7.jpg
https://cdn.ncbi.nlm.nih.gov/pmc/blobs/f545/1630694/1883abe0baf4/1476-072X-5-46-8.jpg
https://cdn.ncbi.nlm.nih.gov/pmc/blobs/f545/1630694/6719a051cec9/1476-072X-5-46-9.jpg
https://cdn.ncbi.nlm.nih.gov/pmc/blobs/f545/1630694/c5b4e8234364/1476-072X-5-46-10.jpg
https://cdn.ncbi.nlm.nih.gov/pmc/blobs/f545/1630694/05b0803e1f17/1476-072X-5-46-11.jpg
https://cdn.ncbi.nlm.nih.gov/pmc/blobs/f545/1630694/60e8708b8158/1476-072X-5-46-12.jpg

相似文献

1
Identifying geographic areas with high disease rates: when do confidence intervals for rates and a disease cluster detection method agree?识别疾病高发的地理区域:发病率的置信区间与疾病聚集性检测方法何时一致?
Int J Health Geogr. 2006 Oct 18;5:46. doi: 10.1186/1476-072X-5-46.
2
Spatial event cluster detection using a compound Poisson distribution.使用复合泊松分布的空间事件聚类检测。
Biometrics. 2006 Jun;62(2):465-70. doi: 10.1111/j.1541-0420.2005.00503.x.
3
Statistical disease cluster surveillance of medically treated self-inflicted injuries in Alberta, Canada.加拿大艾伯塔省医疗救治的自残伤害的统计性疾病聚集监测。
Chronic Dis Can. 2006;27(2):68-76.
4
Effects of randomization methods on statistical inference in disease cluster detection.随机化方法对疾病聚集性检测中统计推断的影响。
Health Place. 2007 Mar;13(1):152-63. doi: 10.1016/j.healthplace.2005.11.003. Epub 2006 Jan 6.
5
The analysis of registry data in relation to various different types of hypothesis regarding the geographical distribution of disease.对登记数据进行分析,以探讨与疾病地理分布相关的各种不同类型的假设。
Cent Eur J Public Health. 1997 Jun;5(2):90-2.
6
An extended power of cluster detection tests.聚类检测测试的扩展功效
Stat Med. 2006 Mar 15;25(5):841-52. doi: 10.1002/sim.2419.
7
Methods for confidence interval estimation of a ratio parameter with application to location quotients.用于比率参数置信区间估计的方法及其在区位商中的应用。
BMC Med Res Methodol. 2005 Oct 12;5:32. doi: 10.1186/1471-2288-5-32.
8
A comparison of the statistical power of different methods for the analysis of cluster randomization trials with binary outcomes.二元结局整群随机试验不同分析方法的统计效能比较。
Stat Med. 2007 Aug 30;26(19):3550-65. doi: 10.1002/sim.2813.
9
Do variations in disease prevalence limit the usefulness of population-based hospitalization rates for studying variations in hospital admissions?
Med Care. 2005 Jan;43(1):4-11.
10
A polygon-based locally-weighted-average method for smoothing disease rates of small units.一种基于多边形的局部加权平均方法,用于平滑小单位的疾病发病率。
Epidemiology. 2007 Sep;18(5):523-8. doi: 10.1097/EDE.0b013e3181271ac8.

引用本文的文献

1
High-risk spatiotemporal patterns of leprosy in the southeastern region of Yunnan province from 2010 to 2022: an analysis at the township level.2010 年至 2022 年云南省东南部地区麻风病的高危时空模式:乡镇级分析。
BMC Public Health. 2024 Oct 4;24(1):2707. doi: 10.1186/s12889-024-20182-9.
2
High-risk spatiotemporal patterns of cutaneous leishmaniasis: a nationwide study in Iran from 2011 to 2020.高危时空模式的皮肤利什曼病:伊朗全国范围内 2011 至 2020 年的研究。
Infect Dis Poverty. 2023 May 15;12(1):49. doi: 10.1186/s40249-023-01103-1.
3
Avoidable hospitalizations in Brazil and Portugal: Identifying and comparing critical areas through spatial analysis.

本文引用的文献

1
Geographical distribution of optic nerve hypoplasia and septo-optic dysplasia in Northwest England.英格兰西北部视神经发育不全和视隔发育不良的地理分布。
J Pediatr. 2006 Jan;148(1):85-8. doi: 10.1016/j.jpeds.2005.07.031.
2
The geographical distribution of variant Creutzfeldt-Jakob disease cases in the UK: what can we learn from it?英国变异型克雅氏病病例的地理分布:我们能从中了解到什么?
Stat Methods Med Res. 2003 Jun;12(3):235-46. doi: 10.1191/0962280203sm332ra.
3
Surveillance of clustering near point sources.点源附近聚集情况的监测。
巴西和葡萄牙的可避免住院治疗:通过空间分析确定和比较关键领域。
PLoS One. 2019 Jul 12;14(7):e0219262. doi: 10.1371/journal.pone.0219262. eCollection 2019.
4
Proximity to two main sources of industrial outdoor air pollution and emergency department visits for childhood asthma in Edmonton, Canada.加拿大埃德蒙顿市儿童哮喘急诊就诊与临近两个主要工业户外空气污染源的关系。
Can J Public Health. 2018 Jan 22;108(5-6):e523-e529. doi: 10.17269/cjph.108.6136.
5
Nonparametric intensity bounds for the delineation of spatial clusters.空间聚类划分的非参数强度界限。
Int J Health Geogr. 2011 Jan 7;10:1. doi: 10.1186/1476-072X-10-1.
Stat Med. 1996;15(7-9):727-40. doi: 10.1002/(sici)1097-0258(19960415)15:7/9<727::aid-sim244>3.0.co;2-x.
4
Confidence intervals for directly standardized rates: a method based on the gamma distribution.直接标准化率的置信区间:一种基于伽马分布的方法。
Stat Med. 1997 Apr 15;16(7):791-801. doi: 10.1002/(sici)1097-0258(19970415)16:7<791::aid-sim500>3.0.co;2-#.
5
A class of tests for detecting 'general' and 'focused' clustering of rare diseases.一类用于检测罕见疾病“一般”和“聚焦”聚集性的测试。
Stat Med. 1995;14(21-22):2323-34. doi: 10.1002/sim.4780142105.
6
Investigation of leukaemia clusters by use of a Geographical Analysis Machine.运用地理分析机器对白血病聚集情况进行调查。
Lancet. 1988 Feb 6;1(8580):272-3. doi: 10.1016/s0140-6736(88)90352-2.
7
Monitoring for clusters of disease: application to leukemia incidence in upstate New York.疾病聚集监测:应用于纽约州北部的白血病发病率
Am J Epidemiol. 1990 Jul;132(1 Suppl):S136-43. doi: 10.1093/oxfordjournals.aje.a115775.