Nuckols John R, Gunier Robert B, Riggs Philip, Miller Ryan, Reynolds Peggy, Ward Mary H
Department of Environmental and Radiological Health Sciences, Colorado State University, Fort Collins, Colorado 80523-1681, USA.
Environ Health Perspect. 2007 May;115(5):684-9. doi: 10.1289/ehp.9518. Epub 2007 Jan 4.
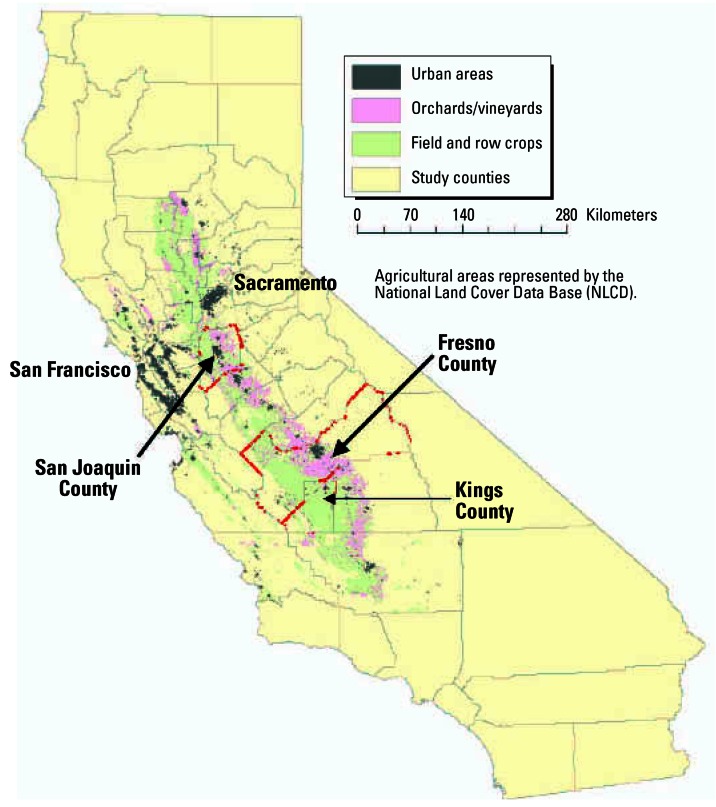
The State of California maintains a comprehensive Pesticide Use Reporting Database (CPUR). The California Department of Water Resources (CDWR) maps all crops in agricultural counties in California about once every 5 years.
We integrated crop maps with CPUR to more accurately locate where pesticides are applied and evaluated the effects for exposure assessment.
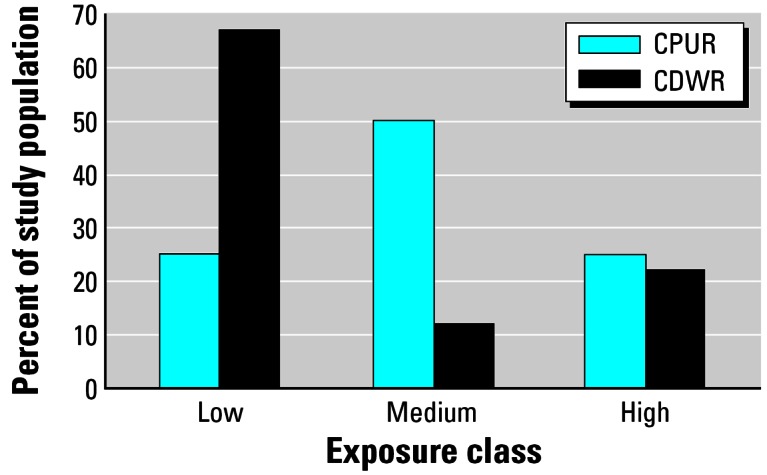
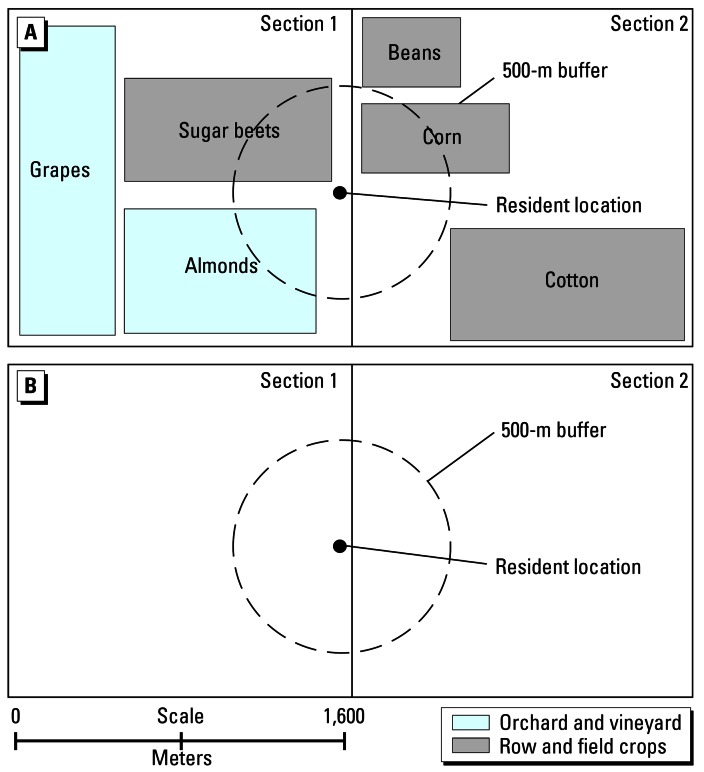
We mapped 577 residences and used the CPUR and CDWR data to compute two exposure metrics based on putative pesticide use within a 500-m buffer. For the CPUR metric, we assigned pesticide exposure to the residence proportionally for all square-mile Sections that intersected the buffer. For the CDWR metric, we linked CPUR crop-specific pesticide use to crops mapped within the buffer and assigned pesticide exposure. We compared the metrics for six pesticides: simazine, trifluralin (herbicides), dicofol, propargite (insecticides), methyl bromide, and metam sodium (fumigants).
For all six pesticides we found good agreement (88-98%) as to whether the pesticide use was predicted. When we restricted the analysis to residences with reported pesticide use in Sections within 500 m, agreement was greatly reduced (35-58%). The CPUR metric estimates of pesticide use within 500 m were significantly higher than the CDWR metric for all six pesticides.
Our findings may have important implications for exposure classification in epidemiologic studies of agricultural pesticide use using CPUR. There is a need to conduct environmental and biological measurements to ascertain which, if any, of these metrics best represent exposure.
加利福尼亚州维护着一个全面的农药使用报告数据库(CPUR)。加利福尼亚州水资源部(CDWR)大约每5年对加利福尼亚州农业县的所有农作物进行一次测绘。
我们将农作物地图与CPUR整合,以更准确地确定农药的施用地点,并评估其对暴露评估的影响。
我们绘制了577处住宅的地图,并使用CPUR和CDWR数据,基于500米缓冲区内假定的农药使用情况计算了两个暴露指标。对于CPUR指标,我们将农药暴露按比例分配给与缓冲区相交的所有平方英里区域内的住宅。对于CDWR指标,我们将CPUR特定作物的农药使用与缓冲区内绘制的作物相关联,并分配农药暴露量。我们比较了六种农药的指标:西玛津、氟乐灵(除草剂)、三氯杀螨醇、克螨特(杀虫剂)、甲基溴和威百亩(熏蒸剂)。
对于所有六种农药,我们发现关于农药使用是否被预测的一致性良好(88%-98%)。当我们将分析限制在500米范围内有报告农药使用的区域内的住宅时,一致性大大降低(35%-58%)。对于所有六种农药,CPUR指标对500米范围内农药使用的估计显著高于CDWR指标。
我们的研究结果可能对使用CPUR进行的农业农药使用流行病学研究中的暴露分类具有重要意义。需要进行环境和生物测量,以确定这些指标中哪一个(如果有的话)最能代表暴露情况。