Ohta Akiko, Murakami Yoshitaka, Hashimoto Shuji, Nagai Masaki, Kawado Miyuki, Izumida Michiko, Tada Yuki, Shigematsu Mika, Yasui Yoshinori, Taniguchi Kiyosu
Department of Public Health, Saitama Medical University Faculty of Medicine, 38 Morohongo, Moroyama-machi, Iruma-gun Saitama 350-0495, Japan.
J Epidemiol. 2007 Dec;17 Suppl(Suppl):S14-22. doi: 10.2188/jea.17.s14.
A method for determining epidemics in small areas from the sentinel surveillance data has been proposed and applied in the National Epidemiological Surveillance of Infectious Diseases (NESID) in Japan. We observed epidemics of influenza and 11 pediatric diseases by the method in the NESID in Japan during 1999-2005.
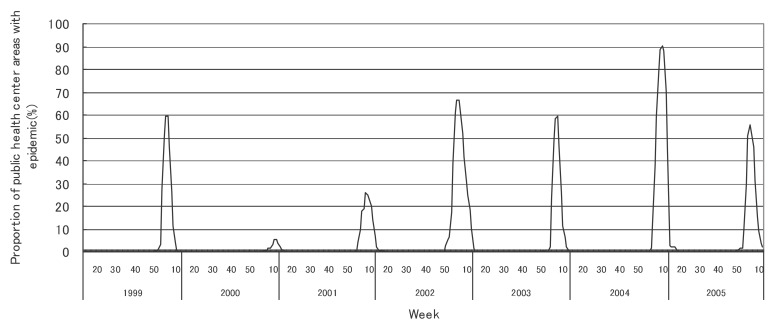
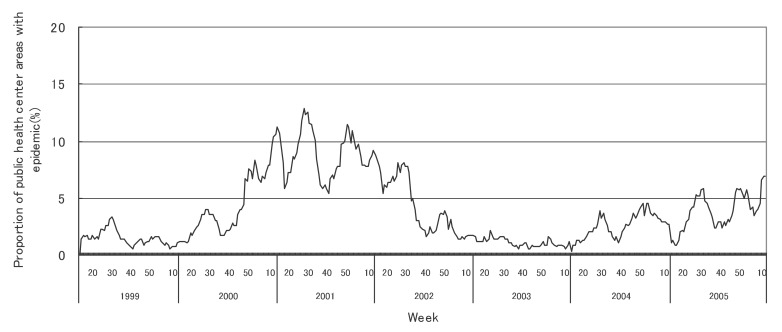
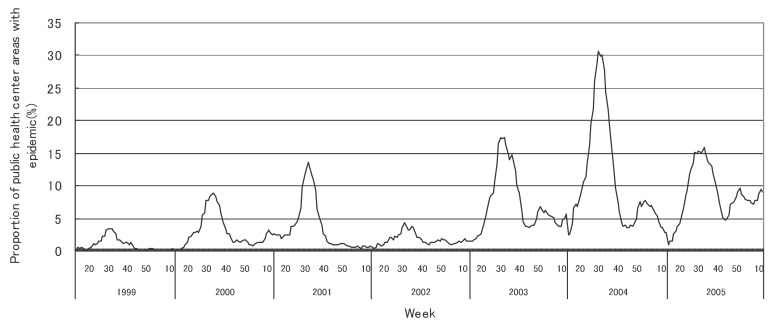
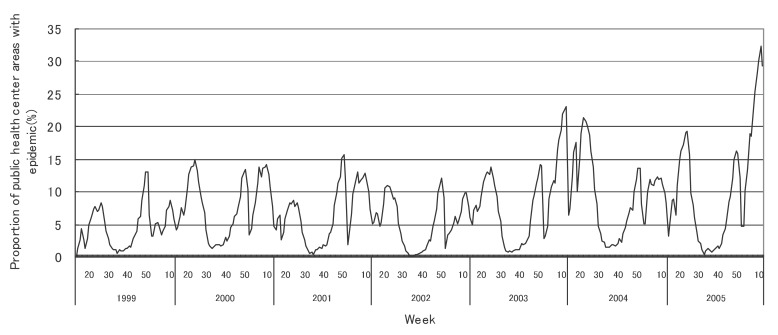
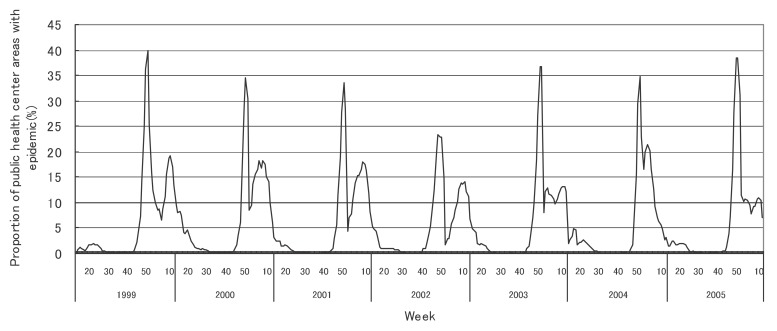
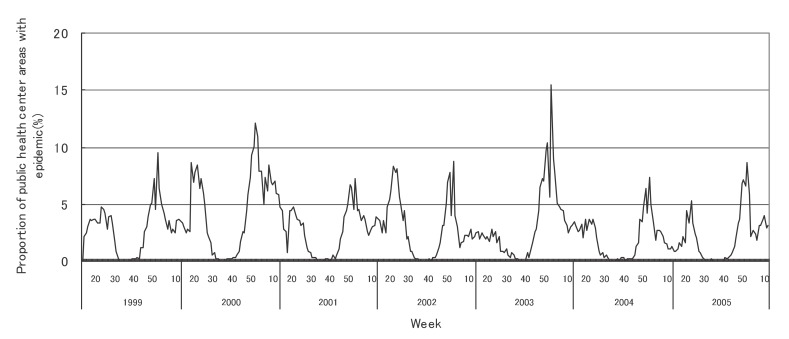
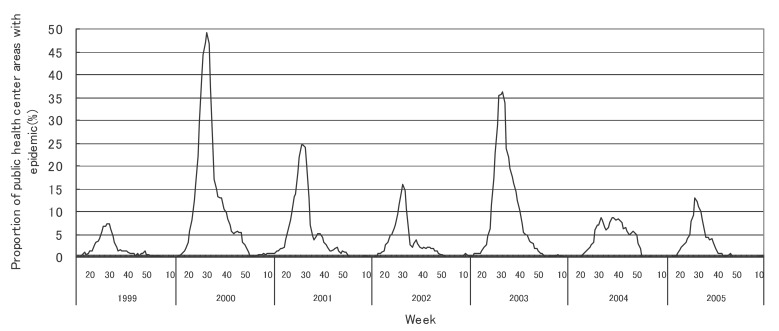
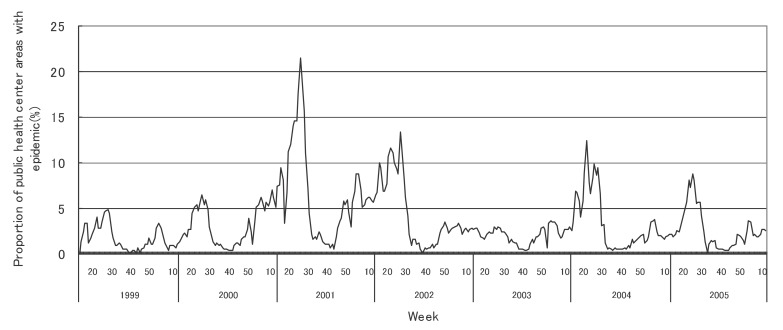
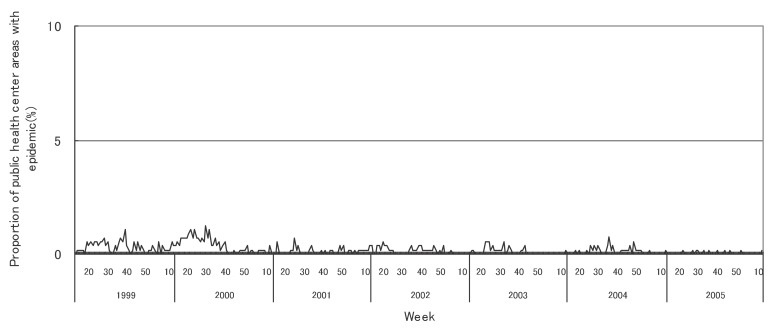
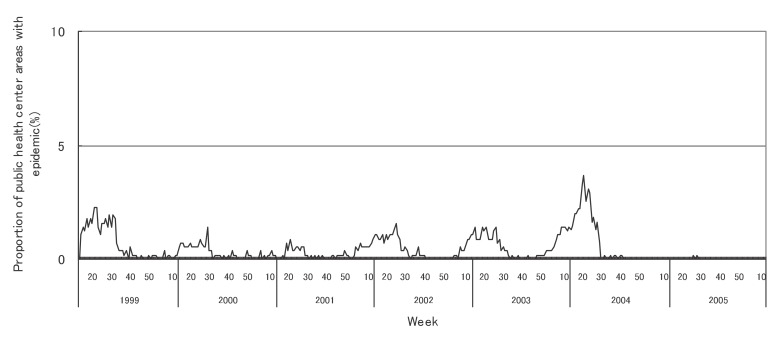
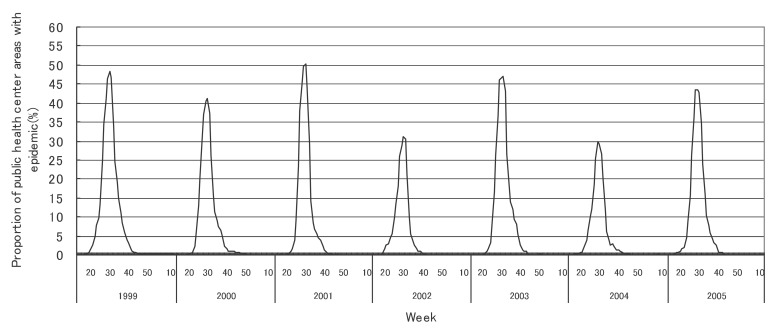
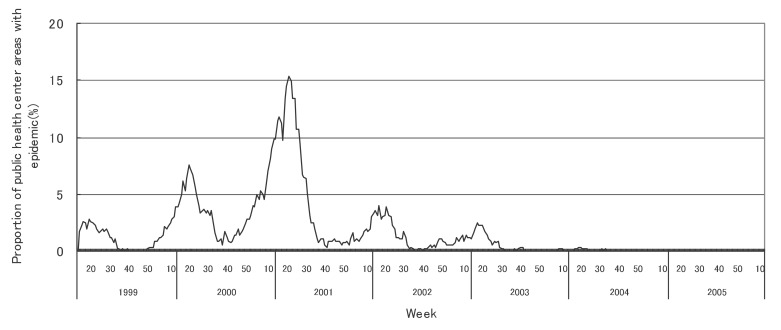
We assumed that an epidemic in a public health center area began in a week when the number of cases reported to the NESID per sentinel clinic and hospital in the area in the week exceeded a given value, and that the epidemic ended when the number was lower than another given value. The proportion of public health center areas with epidemics (epidemic area proportion) by week in fiscal 1999-2005 was calculated. Total public health center area-weeks observed were about 30,000 each year.
The mean epidemic area proportion in the 7 years was 6.0% for influenza and 0.2-7.4% for pediatric diseases. The proportion increased in pharyngoconjunctival fever and group A streptococcal pharyngitis, decreased in measles and was less than 1.0% in pertussis and rubella. In influenza, the height of the peak in the weekly epidemic area proportion varied between 6 and 90% in the 7 years and the week of the peak varied widely. In some pediatric diseases, the height of the peak varied, while the week of the peak was relatively constant.
The frequency and temporal change were described in the epidemics of influenza and pediatric diseases in public health center areas from the NESID data in Japan, 1999-2005.
一种根据哨点监测数据确定小区域内疫情的方法已被提出,并应用于日本全国传染病流行病学监测(NESID)。我们在1999 - 2005年期间,通过该方法在日本的NESID中观察了流感和11种儿科疾病的疫情。
我们假设,当某公共卫生中心区域内每个哨点诊所和医院向NESID报告的病例数在某一周超过给定值时,该区域的疫情开始;当病例数低于另一个给定值时,疫情结束。计算了1999 - 2005财政年度各周出现疫情的公共卫生中心区域的比例(疫情区域比例)。每年观察到的公共卫生中心区域 - 周数总计约为30,000。
7年中,流感的平均疫情区域比例为6.0%,儿科疾病的平均疫情区域比例为0.2 - 7.4%。咽结膜热和A组链球菌性咽炎的比例上升,麻疹的比例下降,百日咳和风疹的比例低于1.0%。在流感方面,7年中每周疫情区域比例峰值的高度在6%至90%之间变化,且峰值出现的周数差异很大。在一些儿科疾病中,峰值高度有所变化,而峰值出现的周数相对稳定。
根据1999 - 2005年日本NESID数据,描述了公共卫生中心区域内流感和儿科疾病疫情的频率和时间变化。