• 文献检索
  • 文档翻译
  • 深度研究
  • 学术资讯
  • Suppr Zotero 插件Zotero 插件
  • 邀请有礼
  • 套餐&价格
  • 历史记录
应用&插件
Suppr Zotero 插件Zotero 插件浏览器插件Mac 客户端Windows 客户端微信小程序
定价
高级版会员购买积分包购买API积分包
服务
文献检索文档翻译深度研究API 文档MCP 服务
关于我们
关于 Suppr公司介绍联系我们用户协议隐私条款
关注我们

Suppr 超能文献

核心技术专利:CN118964589B侵权必究
粤ICP备2023148730 号-1Suppr @ 2026

文献检索

告别复杂PubMed语法,用中文像聊天一样搜索,搜遍4000万医学文献。AI智能推荐,让科研检索更轻松。

立即免费搜索

文件翻译

保留排版,准确专业,支持PDF/Word/PPT等文件格式,支持 12+语言互译。

免费翻译文档

深度研究

AI帮你快速写综述,25分钟生成高质量综述,智能提取关键信息,辅助科研写作。

立即免费体验

乳腺实质致密度的空间分布:一项纵向研究。

The spatial distribution of radiodense breast tissue: a longitudinal study.

机构信息

Cancer Research UK Epidemiology and Genetics Group, Department of Epidemiology and Population Health, London School of Hygiene and Tropical Medicine, London, UK.

出版信息

Breast Cancer Res. 2009;11(3):R33. doi: 10.1186/bcr2318. Epub 2009 Jun 3.

DOI:10.1186/bcr2318
PMID:19490643
原文链接:https://pmc.ncbi.nlm.nih.gov/articles/PMC2716501/
Abstract

INTRODUCTION

Mammographic breast density is one of the strongest known markers of susceptibility to breast cancer. To date research into density has relied on a single measure (for example, percent density (PD)) summarising the average level of density for the whole breast, with no consideration of how the radiodense tissue may be distributed. This study aims to investigate the spatial distribution of density within the breast using 493 mammographic images from a sample of 165 premenopausal women (~3 medio-lateral oblique views per woman).

METHODS

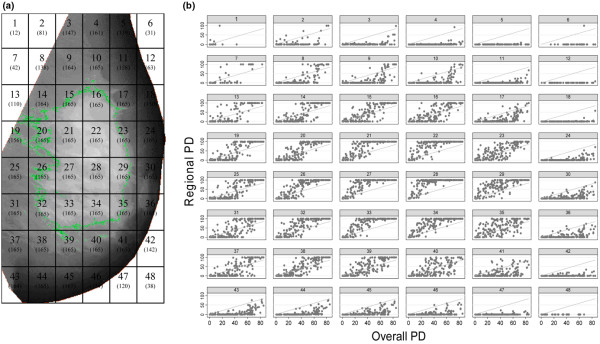
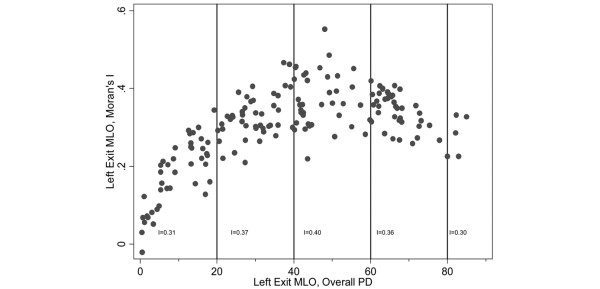
Each breast image was divided into 48 regions and the PD for the whole breast (overall PD) and for each one of its regions (regional PD) was estimated. The spatial autocorrelation (Moran's I value) of regional PD for each image was calculated to investigate spatial clustering of density, whether the degree of clustering varied between a woman's two breasts and whether it was affected by age and other known density correlates.

RESULTS

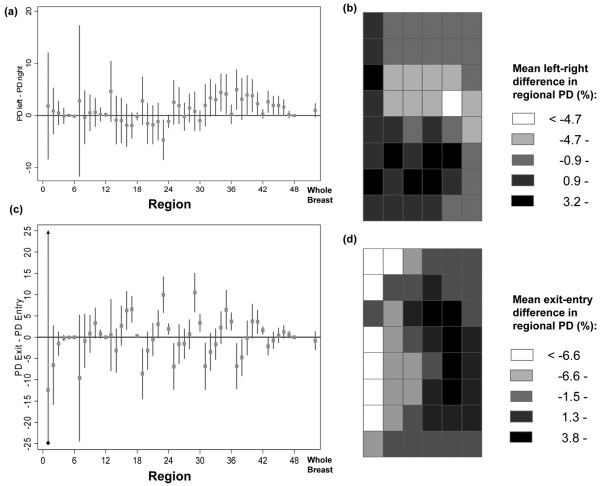
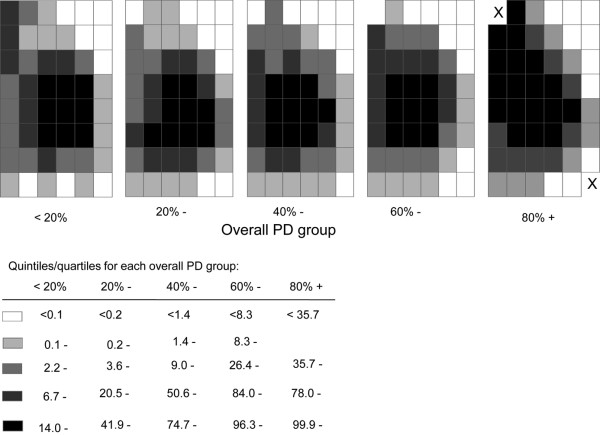
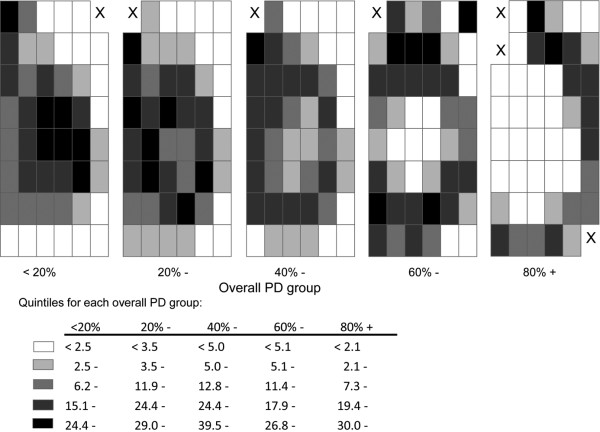
The median Moran's I value for 165 women was 0.31 (interquartile range: 0.26, 0.37), indicating a clustered pattern. High-density areas tended to cluster in the central regions of the breast, regardless of the level of overall PD, but with considerable between-woman variability in regional PD. The degree of clustering was similar between a woman's two breasts (mean within-woman difference in Moran's I values between left and right breasts = 0.00 (95% confidence interval (CI) = -0.01, 0.01); P = 0.76) and did not change with aging (mean within-woman difference in I values between screens taken on average 8 years apart = 0.01 (95% CI = -0.01, 0.02); P = 0.30). Neither parity nor age at first birth affected the level of spatial autocorrelation of density, but increasing body mass index (BMI) was associated with a decrease in the degree of spatial clustering.

CONCLUSIONS

This study is the first to demonstrate that the distribution of radiodense tissue within the breast is spatially autocorrelated, generally with the high-density areas clustering in the central regions of the breast. The degree of clustering was similar within a woman's two breasts and between women, and was little affected by age or reproductive factors although it declined with increasing BMI.

摘要

简介

乳腺密度是已知的乳腺癌易感性最强的标志物之一。迄今为止,对密度的研究依赖于单一指标(例如,百分比密度(PD))来总结整个乳房的平均密度水平,而没有考虑到致密组织可能的分布方式。本研究旨在使用来自 165 名绝经前女性的 493 张乳房 X 光片(每个女性约有 3 张侧斜位视图)来研究乳房内密度的空间分布。

方法

将每个乳房图像分为 48 个区域,并估计整个乳房的 PD(总体 PD)和每个区域的 PD(区域 PD)。计算每个图像的区域 PD 的空间自相关(Moran's I 值),以研究密度的空间聚类,聚类程度是否在女性的两个乳房之间有所不同,以及是否受年龄和其他已知密度相关因素的影响。

结果

165 名女性的中位数 Moran's I 值为 0.31(四分位距:0.26,0.37),表明存在聚类模式。高密度区域往往聚集在乳房的中央区域,无论总体 PD 水平如何,但区域 PD 在女性之间存在很大的差异。女性两个乳房之间的聚类程度相似(左、右乳房之间 Moran's I 值的平均女性内差异= 0.00(95%置信区间(CI)= -0.01,0.01);P = 0.76),并且不会随年龄变化(两次拍摄之间 I 值的平均女性内差异= 0.01(95% CI = -0.01,0.02);P = 0.30)。生育次数和初产年龄均不影响密度的空间自相关水平,但体重指数(BMI)增加与空间聚类程度降低有关。

结论

本研究首次证明,乳房内致密组织的分布具有空间自相关性,通常高密度区域聚集在乳房的中央区域。在女性的两个乳房之间以及女性之间,聚类程度相似,并且受年龄或生殖因素的影响较小,尽管它随 BMI 的增加而下降。

https://cdn.ncbi.nlm.nih.gov/pmc/blobs/b6e8/2716501/33f0326faa5c/bcr2318-5.jpg
https://cdn.ncbi.nlm.nih.gov/pmc/blobs/b6e8/2716501/bd9cdcd4975c/bcr2318-1.jpg
https://cdn.ncbi.nlm.nih.gov/pmc/blobs/b6e8/2716501/8468cf0de271/bcr2318-2.jpg
https://cdn.ncbi.nlm.nih.gov/pmc/blobs/b6e8/2716501/a7a4993b133c/bcr2318-3.jpg
https://cdn.ncbi.nlm.nih.gov/pmc/blobs/b6e8/2716501/39efddf1b9af/bcr2318-4.jpg
https://cdn.ncbi.nlm.nih.gov/pmc/blobs/b6e8/2716501/33f0326faa5c/bcr2318-5.jpg

相似文献

1
The spatial distribution of radiodense breast tissue: a longitudinal study.乳腺实质致密度的空间分布:一项纵向研究。
Breast Cancer Res. 2009;11(3):R33. doi: 10.1186/bcr2318. Epub 2009 Jun 3.
2
Mammographic Breast Density in Chinese Women: Spatial Distribution and Autocorrelation Patterns.中国女性乳腺钼靶密度:空间分布与自相关模式
PLoS One. 2015 Sep 2;10(9):e0136881. doi: 10.1371/journal.pone.0136881. eCollection 2015.
3
Estimation of breast percent density in raw and processed full field digital mammography images via adaptive fuzzy c-means clustering and support vector machine segmentation.通过自适应模糊C均值聚类和支持向量机分割法估计原始及处理后的全视野数字化乳腺摄影图像中的乳腺密度百分比
Med Phys. 2012 Aug;39(8):4903-17. doi: 10.1118/1.4736530.
4
Spatial Distribution and Quantification of Mammographic Breast Density, and Its Correlation with BI-RADS Using an Image Segmentation Method.使用图像分割方法对乳腺钼靶密度进行空间分布和量化及其与乳腺影像报告和数据系统(BI-RADS)的相关性
Life (Basel). 2021 Jun 3;11(6):516. doi: 10.3390/life11060516.
5
Reproductive factors and mammographic density within the International Consortium of Mammographic Density: A cross-sectional study.国际乳腺密度研究联盟内的生殖因素与乳腺 X 线摄影密度:一项横断面研究。
Breast Cancer Res. 2024 Sep 30;26(1):139. doi: 10.1186/s13058-024-01890-x.
6
Mammographic density by time and breast: a retrospective cohort study from BreastScreen Norway.不同时间及不同乳房的乳腺钼靶密度:来自挪威乳腺筛查项目的一项回顾性队列研究
Breast Cancer Res. 2025 May 16;27(1):83. doi: 10.1186/s13058-025-02037-2.
7
The relationship of mammographic density and age: implications for breast cancer screening.乳腺密度与年龄的关系:对乳腺癌筛查的影响。
AJR Am J Roentgenol. 2012 Mar;198(3):W292-5. doi: 10.2214/AJR.10.6049.
8
Association of Screening With Digital Breast Tomosynthesis vs Digital Mammography With Risk of Interval Invasive and Advanced Breast Cancer.与数字乳腺断层合成术相比,数字乳腺钼靶筛查与间隔期浸润性和高级别乳腺癌风险的关联。
JAMA. 2022 Jun 14;327(22):2220-2230. doi: 10.1001/jama.2022.7672.
9
Longitudinal fluctuation in mammographic percent density differentiates between interval and screen-detected breast cancer.乳腺钼靶密度百分比的纵向波动可区分间期乳腺癌和筛查发现的乳腺癌。
Int J Cancer. 2017 Jan 1;140(1):34-40. doi: 10.1002/ijc.30427. Epub 2016 Sep 24.
10
Predicting interval and screen-detected breast cancers from mammographic density defined by different brightness thresholds.根据不同亮度阈值定义的乳腺密度预测间期和筛查性乳腺癌。
Breast Cancer Res. 2018 Dec 13;20(1):152. doi: 10.1186/s13058-018-1081-0.

引用本文的文献

1
Enhancing breast cancer detection on screening mammogram using self-supervised learning and a hybrid deep model of Swin Transformer and convolutional neural networks.使用自监督学习以及Swin Transformer和卷积神经网络的混合深度模型提高筛查乳腺钼靶片中的乳腺癌检测率。
J Med Imaging (Bellingham). 2025 Nov;12(Suppl 2):S22007. doi: 10.1117/1.JMI.12.S2.S22007. Epub 2025 May 14.
2
Local Extremum Mapping for Weak Supervision Learning on Mammogram Classification and Localization.用于乳房X光片分类与定位的弱监督学习的局部极值映射
Bioengineering (Basel). 2025 Mar 21;12(4):325. doi: 10.3390/bioengineering12040325.
3

本文引用的文献

1
Premenopausal mammographic density in relation to cyclic variations in endogenous sex hormone levels, prolactin, and insulin-like growth factors.绝经前乳腺钼靶密度与内源性性激素水平、催乳素及胰岛素样生长因子的周期性变化的关系
Cancer Res. 2009 Aug 15;69(16):6490-9. doi: 10.1158/0008-5472.CAN-09-0280.
2
Texture features from mammographic images and risk of breast cancer.乳腺X线图像的纹理特征与乳腺癌风险
Cancer Epidemiol Biomarkers Prev. 2009 Mar;18(3):837-45. doi: 10.1158/1055-9965.EPI-08-0631. Epub 2009 Mar 3.
3
Tumour location is not an independent prognostic factor for survival following a diagnosis of breast cancer.
Reducing False-Positive Biopsies using Deep Neural Networks that Utilize both Local and Global Image Context of Screening Mammograms.
利用深度学习神经网络,利用筛查性乳房 X 光照片的局部和全局图像上下文减少假阳性活检。
J Digit Imaging. 2021 Dec;34(6):1414-1423. doi: 10.1007/s10278-021-00530-6. Epub 2021 Nov 3.
4
Spatial Distribution and Quantification of Mammographic Breast Density, and Its Correlation with BI-RADS Using an Image Segmentation Method.使用图像分割方法对乳腺钼靶密度进行空间分布和量化及其与乳腺影像报告和数据系统(BI-RADS)的相关性
Life (Basel). 2021 Jun 3;11(6):516. doi: 10.3390/life11060516.
5
An interpretable classifier for high-resolution breast cancer screening images utilizing weakly supervised localization.一种利用弱监督定位的高分辨率乳腺癌筛查图像可解释分类器。
Med Image Anal. 2021 Feb;68:101908. doi: 10.1016/j.media.2020.101908. Epub 2020 Dec 16.
6
Virtual assessment of stereoscopic viewing of digital breast tomosynthesis projection images.数字乳腺断层合成投影图像立体视觉的虚拟评估
J Med Imaging (Bellingham). 2018 Jan;5(1):015501. doi: 10.1117/1.JMI.5.1.015501. Epub 2018 Jan 17.
7
Breast Tissue Organisation and its Association with Breast Cancer Risk.乳腺组织及其与乳腺癌风险的关联。
Breast Cancer Res. 2017 Sep 6;19(1):103. doi: 10.1186/s13058-017-0894-6.
8
Evaluation of the association between quantitative mammographic density and breast cancer occurred in different quadrants.评估不同象限乳腺钼靶定量密度与乳腺癌之间的关联。
BMC Cancer. 2017 Apr 17;17(1):274. doi: 10.1186/s12885-017-3270-0.
9
3D MRI for Quantitative Analysis of Quadrant Percent Breast Density: Correlation with Quadrant Location of Breast Cancer.用于乳腺象限百分比密度定量分析的3D磁共振成像:与乳腺癌象限位置的相关性
Acad Radiol. 2017 Jul;24(7):811-817. doi: 10.1016/j.acra.2016.12.016. Epub 2017 Jan 26.
10
Mammographic Breast Density in Chinese Women: Spatial Distribution and Autocorrelation Patterns.中国女性乳腺钼靶密度:空间分布与自相关模式
PLoS One. 2015 Sep 2;10(9):e0136881. doi: 10.1371/journal.pone.0136881. eCollection 2015.
肿瘤位置并非乳腺癌诊断后生存情况的独立预后因素。
Breast. 2009 Feb;18(1):41-6. doi: 10.1016/j.breast.2008.10.004. Epub 2008 Nov 22.
4
Mammographic density, lobular involution, and risk of breast cancer.乳腺钼靶密度、小叶退化与乳腺癌风险
Br J Cancer. 2008 Nov 4;99(9):1369-74. doi: 10.1038/sj.bjc.6604635. Epub 2008 Sep 9.
5
Primary tumor location impacts breast cancer survival.原发性肿瘤位置影响乳腺癌的生存率。
Am J Surg. 2008 May;195(5):641-4. doi: 10.1016/j.amjsurg.2007.12.039.
6
Basic physics and doubts about relationship between mammographically determined tissue density and breast cancer risk.基础物理学以及关于乳腺钼靶检查确定的组织密度与乳腺癌风险之间关系的疑问。
Radiology. 2008 Feb;246(2):348-53. doi: 10.1148/radiol.2461070309.
7
Mammographic density. Potential mechanisms of breast cancer risk associated with mammographic density: hypotheses based on epidemiological evidence.乳腺钼靶密度。与乳腺钼靶密度相关的乳腺癌风险潜在机制:基于流行病学证据的假说。
Breast Cancer Res. 2008;10(1):201. doi: 10.1186/bcr1831. Epub 2008 Jan 9.
8
Strong evidence of a genetic determinant for mammographic density, a major risk factor for breast cancer.乳腺X线密度是乳腺癌的一个主要危险因素,有强有力的证据表明其存在遗传决定因素。
Cancer Res. 2007 Sep 1;67(17):8412-8. doi: 10.1158/0008-5472.CAN-07-1076.
9
Mammographic density and the risk and detection of breast cancer.乳腺钼靶密度与乳腺癌的风险及检测
N Engl J Med. 2007 Jan 18;356(3):227-36. doi: 10.1056/NEJMoa062790.
10
Mammographic breast density as a general marker of breast cancer risk.乳腺钼靶密度作为乳腺癌风险的一般标志物。
Cancer Epidemiol Biomarkers Prev. 2007 Jan;16(1):43-9. doi: 10.1158/1055-9965.EPI-06-0738.