Beydoun May A, Wang Youfa
Center for Human Nutrition, Department of International Health, Johns Hopkins Bloomberg School of Public Health, Baltimore.
Int J Pediatr Obes. 2011 Feb;6(1):21-35. doi: 10.3109/17477166.2010.488693. Epub 2010 Aug 19.
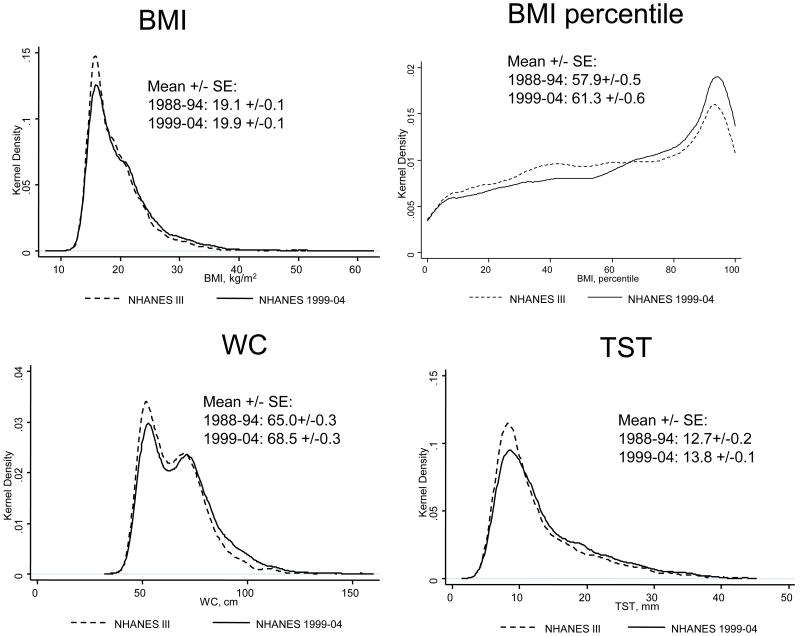
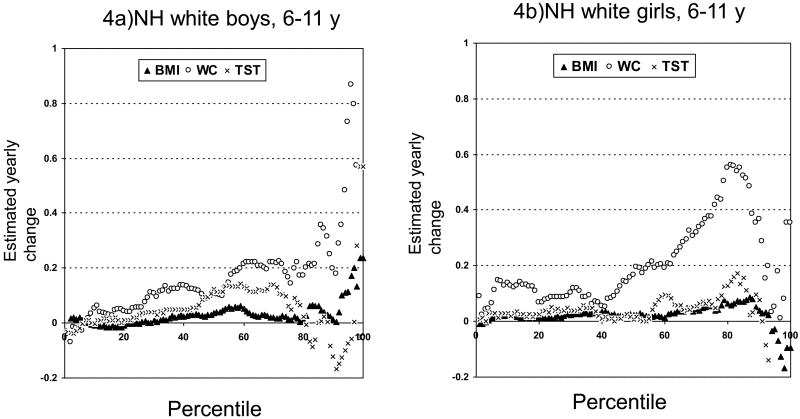
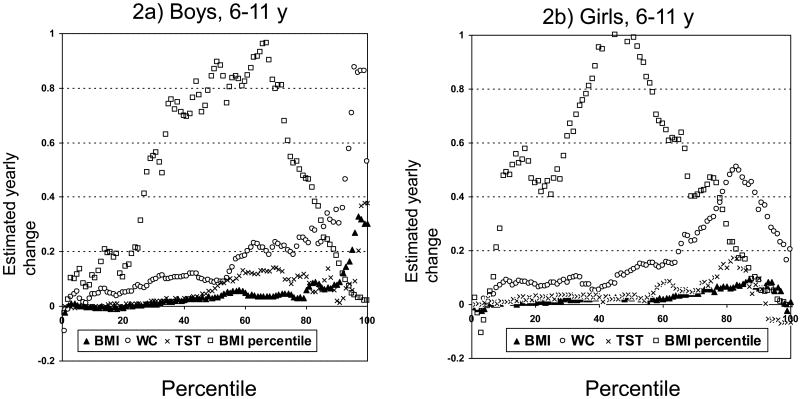
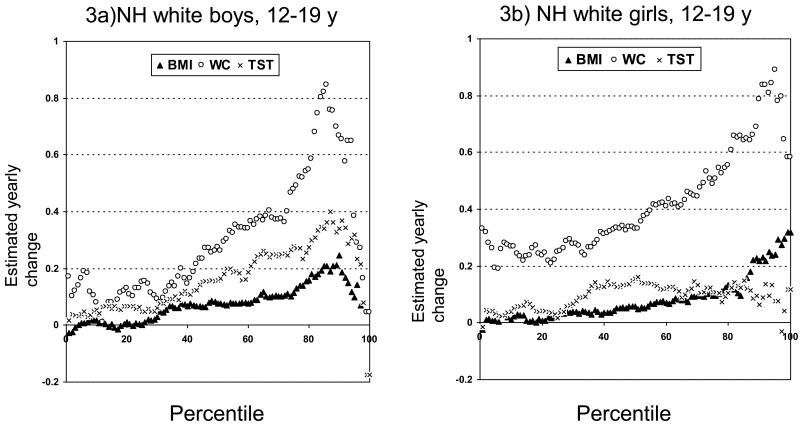
Background. While obesity prevalence in the US has been increasing, adiposity shifts may vary across socio-demographic groups, and various adiposity measures may reveal different patterns. Methods. To study changes over time in adiposity measures, distributional shifts in body mass index (BMI, kg/m(2)), BMI-percentile, waist circumference (WC) and triceps skinfold thickness (TST), and compare between-group differences, National Health and Nutrition Examination Surveys (NHANES) III 1988-94 and 1999-2004 from children aged 2-19 years old data were analyzed. Annual shift in adiposity measures across percentiles were shown as Tukey's mean-difference plots, with percentile-specific mean differences being divided by 10.5 years. Overall and quintile-specific adjusted shifts were estimated from multivariate ordinary least square (OLS) regression models. Results. Mean 10.5-year increases in adiposity were statistically significant, higher in older groups, more pronounced in some sex-ethnic groups (e.g., black girls) and at upper percentiles (more obese groups) for most measures and sex-age-ethnic groups. Adjusted increase in mean BMI was 0.60 in girls and 0.64 in boys; BMI percentile, 3.02 and 3.15 units; WC, 2.85 and 2.42 cm; and TST, 0.81 and 1.18 mm, for girls and boys, respectively. Ethnic, age and sex disparities in mean BMI became wider over time. Several significant ethnic differences in adjusted adiposity shifts within the lowest (Q1) and uppermost (Q5) quintiles of adiposity measure distributions were noted. Conclusions. The increase in adiposity among American children was unequally distributed across groups and varied across the spectrum of various adiposity measures. Overweight groups gained more adiposity over time, especially WC. Solely examining prevalence shifts masks pattern complexity.
背景。虽然美国的肥胖患病率一直在上升,但肥胖程度的变化可能因社会人口群体而异,并且各种肥胖测量方法可能揭示不同的模式。方法。为了研究肥胖测量指标随时间的变化、体重指数(BMI,kg/m²)、BMI百分位数、腰围(WC)和肱三头肌皮褶厚度(TST)的分布变化,并比较组间差异,分析了1988 - 1994年和1999 - 2004年全国健康和营养检查调查(NHANES)III中2至19岁儿童的数据。肥胖测量指标在各百分位数上的年度变化以图基平均差异图表示,百分位数特定的平均差异除以10.5年。通过多元普通最小二乘法(OLS)回归模型估计总体和五分位数特定的调整变化。结果。肥胖程度平均10.5年的增加具有统计学意义,在年龄较大的组中更高,在一些性别 - 种族组(如黑人女孩)以及大多数测量指标和性别 - 年龄 - 种族组的较高百分位数(更肥胖的组)中更为明显。女孩平均BMI的调整增加量为0.60,男孩为0.64;BMI百分位数分别为3.02和3.15单位;WC分别为2.85和2.42厘米;TST分别为0.81和1.18毫米。随着时间的推移,平均BMI的种族、年龄和性别差异变得更大。在肥胖测量指标分布的最低(Q1)和最高(Q5)五分位数内,注意到调整后的肥胖程度变化存在几个显著的种族差异。结论。美国儿童肥胖程度的增加在各群体中分布不均,并且在各种肥胖测量指标范围内有所不同。超重群体随着时间的推移增加了更多的肥胖程度,尤其是腰围。仅检查患病率变化掩盖了模式的复杂性。