Department of Epidemiology, College of Public Health, University of Iowa, Iowa City, IA, USA.
Obesity Research and Education Initiative, University of Iowa, Iowa City, IA, USA.
BMJ. 2021 Mar 16;372:n365. doi: 10.1136/bmj.n365.
To examine the trends in obesity and adiposity measures, including body mass index, waist circumference, body fat percentage, and lean mass, by race or ethnicity among adults in the United States from 2011 to 2018.
Population based study.
National Health and Nutrition Examination Survey (NHANES), 2011-18.
A nationally representative sample of US adults aged 20 years or older.
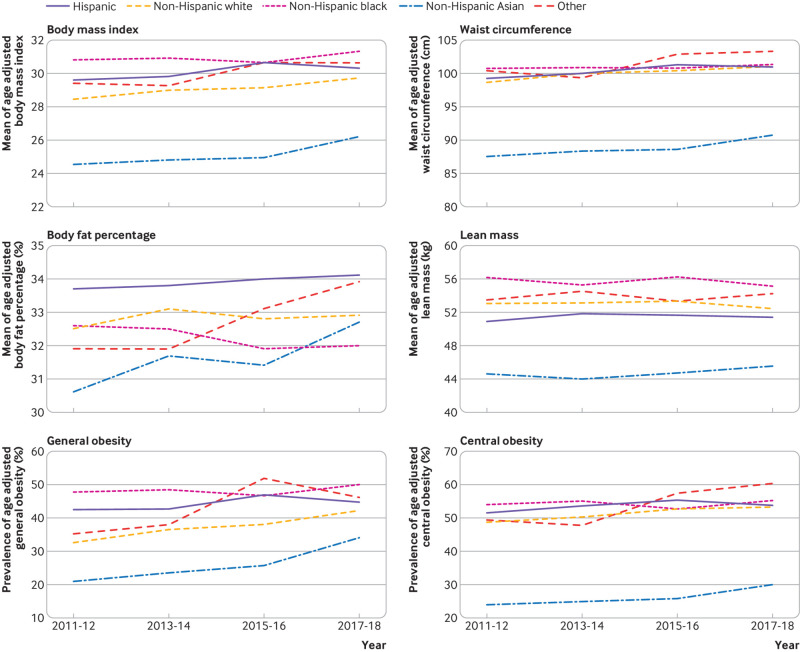
Weight, height, and waist circumference among adults aged 20 years or older were measured by trained technicians using standardized protocols. Obesity was defined as body mass index of 30 or higher for non-Asians and 27.5 or higher for Asians. Abdominal obesity was defined as a waist circumference of 102 cm or larger for men and 88 cm or larger for women. Body fat percentage and lean mass were measured among adults aged 20-59 years by using dual energy x ray absorptiometry.
This study included 21 399 adults from NHANES 2011-18. Body mass index was measured for 21 093 adults, waist circumference for 20 080 adults, and body fat percentage for 10 864 adults. For the overall population, age adjusted prevalence of general obesity increased from 35.4% (95% confidence interval 32.5% to 38.3%) in 2011-12 to 43.4% (39.8% to 47.0%) in 2017-18 (P for trend<0.001), and age adjusted prevalence of abdominal obesity increased from 54.5% (51.2% to 57.8%) in 2011-12 to 59.1% (55.6% to 62.7%) in 2017-18 (P for trend=0.02). Age adjusted mean body mass index increased from 28.7 (28.2 to 29.1) in 2011-12 to 29.8 (29.2 to 30.4) in 2017-18 (P for trend=0.001), and age adjusted mean waist circumference increased from 98.4 cm (97.4 to 99.5 cm) in 2011-12 to 100.5 cm (98.9 to 102.1 cm) in 2017-18 (P for trend=0.01). Significant increases were observed in body mass index and waist circumference among the Hispanic, non-Hispanic white, and non-Hispanic Asian groups (all P for trend<0.05), but not for the non-Hispanic black group. For body fat percentage, a significant increase was observed among non-Hispanic Asians (30.6%, 29.8% to 31.4% in 2011-12; 32.7%, 32.0% to 33.4% in 2017-18; P for trend=0.001), but not among other racial or ethnic groups. The age adjusted mean lean mass decreased in the non-Hispanic black group and increased in the non-Hispanic Asian group, but no statistically significant changes were found in other racial or ethnic groups.
Among US adults, an increasing trend was found in obesity and adiposity measures from 2011 to 2018, although disparities exist among racial or ethnic groups.
研究 2011 年至 2018 年期间美国成年人中种族或族群之间肥胖和肥胖指标(包括体重指数、腰围、体脂百分比和瘦体重)的趋势。
基于人群的研究。
国家健康与营养调查(NHANES),2011-18 年。
美国 20 岁或以上的具有代表性的成年人样本。
20 岁或以上成年人的体重、身高和腰围由经过培训的技术人员使用标准化协议进行测量。肥胖定义为非亚洲人为体重指数 30 或以上,亚洲人为 27.5 或以上。腹型肥胖定义为男性腰围 102 厘米或以上,女性腰围 88 厘米或以上。20-59 岁成年人的体脂百分比和瘦体重通过双能 X 射线吸收法进行测量。
本研究纳入了来自 NHANES 2011-18 年的 21399 名成年人。体重指数测量了 21093 名成年人,腰围测量了 20080 名成年人,体脂百分比测量了 10864 名成年人。在总体人群中,经过年龄调整的普通肥胖患病率从 2011-12 年的 35.4%(95%置信区间 32.5%至 38.3%)增加到 2017-18 年的 43.4%(39.8%至 47.0%)(趋势 P<0.001),经过年龄调整的腹型肥胖患病率从 2011-12 年的 54.5%(51.2%至 57.8%)增加到 2017-18 年的 59.1%(55.6%至 62.7%)(趋势 P=0.02)。经过年龄调整的平均体重指数从 2011-12 年的 28.7(28.2 至 29.1)增加到 2017-18 年的 29.8(29.2 至 30.4)(趋势 P=0.001),经过年龄调整的平均腰围从 2011-12 年的 98.4 厘米(97.4 至 99.5 厘米)增加到 2017-18 年的 100.5 厘米(98.9 至 102.1 厘米)(趋势 P=0.01)。在西班牙裔、非西班牙裔白人和非西班牙裔亚裔人群中,体重指数和腰围均显著增加(所有趋势 P<0.05),但在非西班牙裔黑人中则没有。在体脂百分比方面,非西班牙裔亚裔人群中观察到显著增加(2011-12 年为 30.6%,29.8%至 31.4%;2017-18 年为 32.7%,32.0%至 33.4%;趋势 P=0.001),但在其他种族或族群中则没有。非西班牙裔黑人组的经过年龄调整的瘦体重均值减少,而非西班牙裔亚裔组的瘦体重均值增加,但在其他种族或族群中没有发现统计学上的显著变化。
在美国成年人中,2011 年至 2018 年肥胖和肥胖指标呈上升趋势,尽管不同种族或族群之间存在差异。