Advocate Christ Medical Center, Oak Lawn, IL.
West J Emerg Med. 2010 Sep;11(4):324-8.
TWO CROWDING METRICS ARE OFTEN USED TO MEASURE EMERGENCY DEPARTMENT (ED) CROWDING: the occupancy rate and the emergency department work index (EDWIN) score. To evaluate these metrics for applicability in our community ED, we sought to measure their correlation with the number of patients who left without being seen (LWBS) and determine if either, or both, correlated with our daily LWBS rate. We hypothesized a statistically significant positive correlation between the number of patients who LWBS and both crowding metrics.
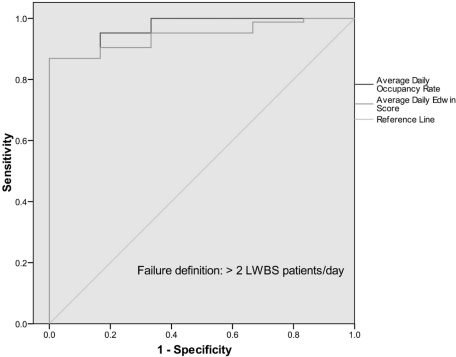
We performed a retrospective observational study by reviewing data on all patients who LWBS from December 1, 2007, to February 29, 2008. Occupancy rates and EDWIN scores were obtained through our electronic patient tracking board. We identified LWBS status by searching the final disposition entered into our electronic medical record. We measured the correlation between each crowding metric averaged over each 24-hour day and the number of patients who LWBS per 24-hour day using Spearman's rank correlation, and created receiver operator characteristic (ROC) curves to quantify the discriminatory power of occupancy rate and EDWIN score for predicting more than two patients per day who LWBS.
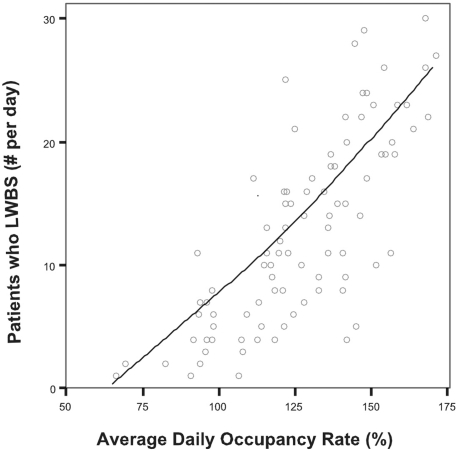
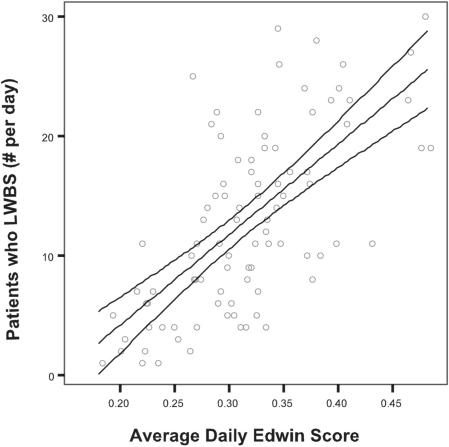
We identified 1,193 patients who LWBS during the study period, including patients who registered but then left the waiting room (733), as well as those who left before: registration (71), triage (75), seeing a physician (260), or final disposition (54). The number of patients who LWBS per day ranged from one to 30, with a mean of 13 and median of 11 (IQR 6 to 19). The daily number of patients who LWBS showed a positive correlation with the average daily occupancy rate (Spearman's rho = 0.771, p = 0.01) and with average daily EDWIN score (Spearman's rho = 0.67, p< .001). Area under the ROC curve for occupancy rate was .97 (95% CI .93 to 1.0) and for EDWIN score was .94 (95% CI .89 to 1.0).
Average daily occupancy rates and EDWIN scores both correlate positively with, and have excellent discriminatory power for, the number of patients who LWBS in our ED; however, the scale of our EDWIN scores differs from that obtained at other institutions. For studies of crowding, occupancy rate may be the more useful metric due to its ease of calculation.
有两种常用的拥挤指标来衡量急诊科(ED)的拥挤程度:入住率和 ED 工作指数(EDWIN)评分。为了评估这些指标在我们社区 ED 的适用性,我们试图测量它们与离开未就诊(LWBS)的患者数量之间的相关性,并确定这两个指标中的任何一个或两个是否与我们的日常 LWBS 率相关。我们假设 LWBS 患者数量与这两个拥挤指标之间存在统计学上显著的正相关。
我们通过回顾 2007 年 12 月 1 日至 2008 年 2 月 29 日期间所有 LWBS 患者的数据进行了回顾性观察研究。入住率和 EDWIN 评分通过我们的电子患者跟踪板获得。我们通过搜索电子病历中输入的最终处置方式来确定 LWBS 状态。我们使用 Spearman 等级相关来测量每个 24 小时平均拥挤指标与每天 24 小时 LWBS 的患者数量之间的相关性,并创建接受者操作特征(ROC)曲线来量化入住率和 EDWIN 评分预测每天超过 2 名 LWBS 患者的能力。
在研究期间,我们确定了 1193 名 LWBS 患者,包括登记后离开等候区的患者(733 名),以及在登记前离开的患者(71 名)、分诊(75 名)、看医生(260 名)或最终处置(54 名)。每天 LWBS 的患者数量从 1 到 30 不等,平均为 13,中位数为 11(IQR 6 到 19)。每天 LWBS 的患者数量与平均每日入住率呈正相关(Spearman's rho = 0.771,p = 0.01)和平均每日 EDWIN 评分(Spearman's rho = 0.67,p<.001)。入住率的 ROC 曲线下面积为 0.97(95%CI 0.93 至 1.0),EDWIN 评分的 ROC 曲线下面积为 0.94(95%CI 0.89 至 1.0)。
平均每日入住率和 EDWIN 评分均与我们 ED 中 LWBS 患者数量呈正相关,且具有出色的区分能力;然而,我们的 EDWIN 评分量表与其他机构获得的量表有所不同。在拥挤研究中,由于易于计算,入住率可能是更有用的指标。