Division of Geriatric Medicine and Meyers Primary Care Institute, University of Massachusetts Medical School and Meyers Primary Care, Worcester, Boston, MA, USA.
Med Care. 2011 Sep;49(9):834-41. doi: 10.1097/MLR.0b013e3182162afb.
The full effect of Medicare Part D, after the initial policy transition period and across the United States Medicare population, remains unclear.
To estimate nationally representative changes in prescription drug use and out-of-pocket drug costs 2 years after implementation of Part D.
DESIGN, SETTING, AND PARTICIPANTS: We examined study outcomes over 8 years (2000 to 2007) and estimated changes after Part D, accounting for earlier trends. Our analyses used the community-dwelling sample of the Medicare Current Beneficiary Survey (unweighted unique n=38,798). Actual post-Part D outcomes were compared with projected values using 2000 to 2005 data. Subgroup analyses and standardization weights were used to address population-level shifts over time in health status and demographic characteristics.
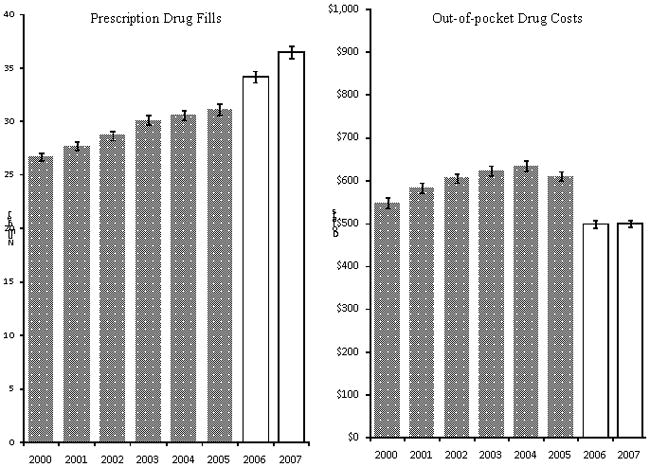
Annual prescription drug fills and out-of-pocket drug costs.
We observed significant average per person increases of 1.8 prescription fills [95% confidence interval (CI), 1.1-2.5] in 2006 and 3.4 prescription fills (95% CI, 2.7-4.1) in 2007 above pre-Part D increases of 0.9 prescription fills per year. Average out-of-pocket drug costs decreased significantly by $143 (95% CI, -182.5--103.1) in 2006 and $148 (95% CI, -181.2--114.1) in 2007 above average pre-Part D increases of $12 per year. Prescription fills did not change for beneficiaries with fair to poor health until 2007 when large increases occurred (increases of 3.7 to 11.0 fills above pre-Part D trends). Significant reductions in OOP drug costs occurred in 2006 and persisted into 2007 across all groups except for sick and poor beneficiaries without Medicaid.
After the transition year of 2006, the impact of Part D seemed larger and more consistent across the Medicare population. Of note, sick and poor beneficiaries experienced significant improvements in prescription drug use in 2007.
在初始政策过渡期之后,医疗保险第 D 部分在美国医疗保险人群中的全面影响仍不清楚。
估计第 D 部分实施后两年内处方药使用和自付药物成本的全国代表性变化。
设计、设置和参与者:我们研究了 8 年(2000 年至 2007 年)的研究结果,并根据早期趋势估计了第 D 部分之后的变化。我们的分析使用了医疗保险当前受益人大调查的社区居住样本(未加权独特 n=38798)。实际的第 D 部分后结果与使用 2000 年至 2005 年数据的预测值进行了比较。亚组分析和标准化权重用于解决随着时间的推移健康状况和人口统计学特征在人口水平上的变化。
每年的处方药用量和自付药物费用。
我们观察到,2006 年人均处方量增加了 1.8 剂[95%置信区间(CI),1.1-2.5],2007 年增加了 3.4 剂(95%CI,2.7-4.1),高于每年增加 0.9 剂的预第 D 部分增加。2006 年自付药物费用显著下降 143 美元(95%CI,-182.5--103.1),2007 年下降 148 美元(95%CI,-181.2--114.1),高于每年增加 12 美元的平均预第 D 部分增加。2007 年之前,健康状况中等至较差的受益人处方量没有变化,而 2007 年则出现了大幅增加(比预第 D 部分趋势增加 3.7 至 11.0 剂)。2006 年和 2007 年,除了没有医疗补助的患病和贫困受益人外,所有群体的自付药物费用都显著降低。
在 2006 年的过渡年后,第 D 部分的影响似乎在医疗保险人群中更大且更一致。值得注意的是,2007 年患病和贫困的受益人在处方药使用方面有了显著的改善。