National Biodefense Analysis and Countermeasures Center, 110 Thomas Johnson Drive, Frederick, MD 21702, USA.
BMC Bioinformatics. 2011 Sep 30;12:385. doi: 10.1186/1471-2105-12-385.
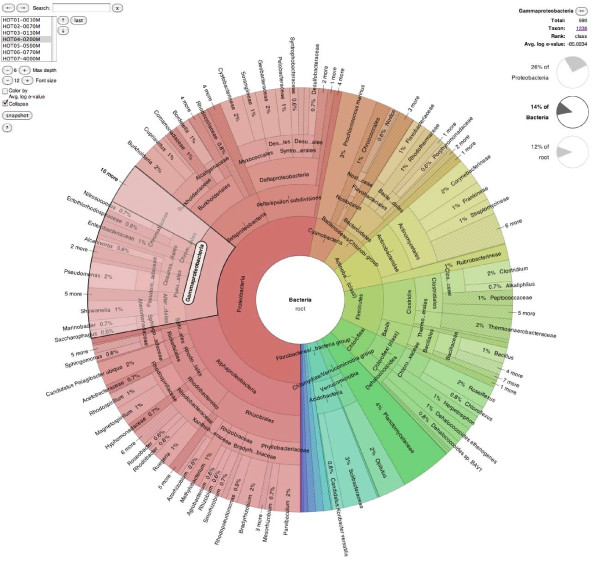
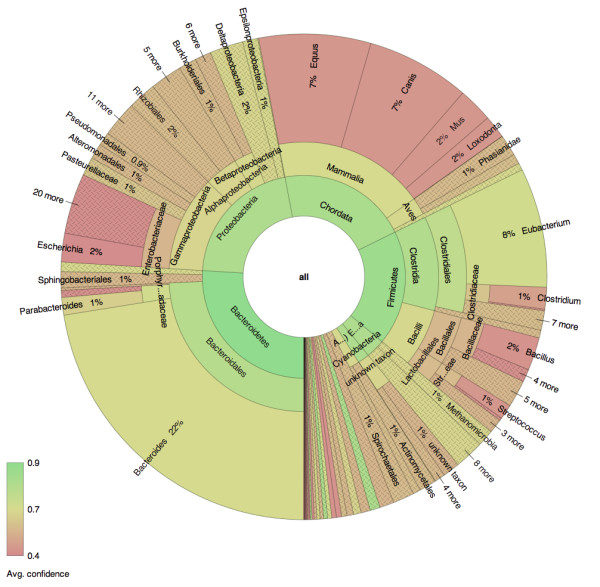
A critical output of metagenomic studies is the estimation of abundances of taxonomical or functional groups. The inherent uncertainty in assignments to these groups makes it important to consider both their hierarchical contexts and their prediction confidence. The current tools for visualizing metagenomic data, however, omit or distort quantitative hierarchical relationships and lack the facility for displaying secondary variables.
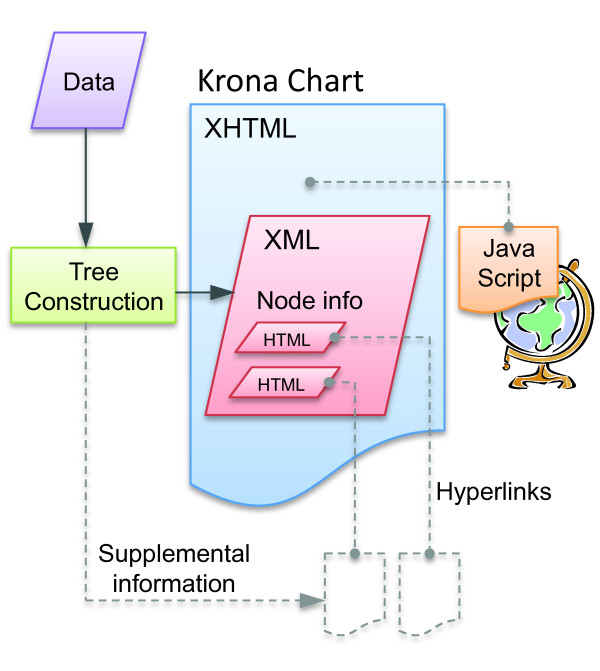
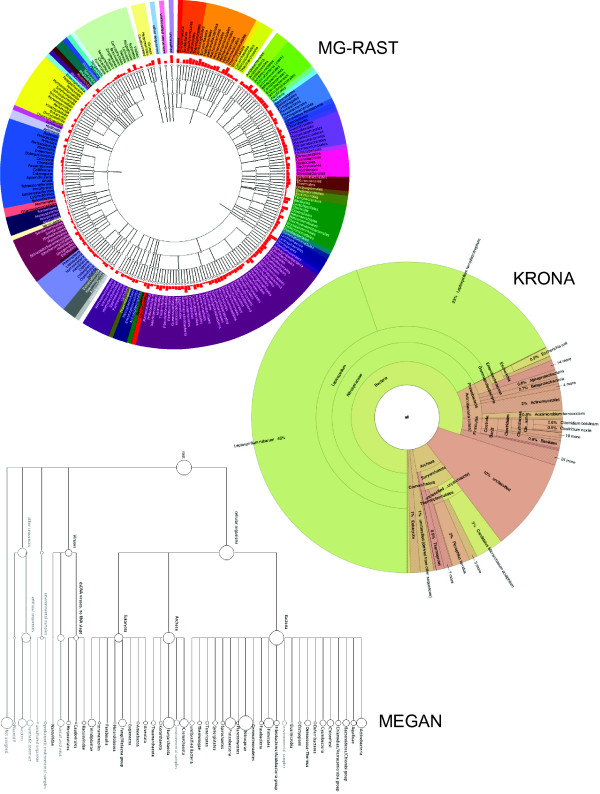
Here we present Krona, a new visualization tool that allows intuitive exploration of relative abundances and confidences within the complex hierarchies of metagenomic classifications. Krona combines a variant of radial, space-filling displays with parametric coloring and interactive polar-coordinate zooming. The HTML5 and JavaScript implementation enables fully interactive charts that can be explored with any modern Web browser, without the need for installed software or plug-ins. This Web-based architecture also allows each chart to be an independent document, making them easy to share via e-mail or post to a standard Web server. To illustrate Krona's utility, we describe its application to various metagenomic data sets and its compatibility with popular metagenomic analysis tools.
Krona is both a powerful metagenomic visualization tool and a demonstration of the potential of HTML5 for highly accessible bioinformatic visualizations. Its rich and interactive displays facilitate more informed interpretations of metagenomic analyses, while its implementation as a browser-based application makes it extremely portable and easily adopted into existing analysis packages. Both the Krona rendering code and conversion tools are freely available under a BSD open-source license, and available from: http://krona.sourceforge.net.
宏基因组研究的一个关键输出是对分类或功能组丰度的估计。这些分组的分配存在固有不确定性,因此考虑它们的层次上下文及其预测置信度非常重要。然而,目前用于可视化宏基因组数据的工具忽略或歪曲了定量层次关系,并且缺乏显示次要变量的功能。
我们在这里介绍 Krona,这是一种新的可视化工具,它允许直观地探索宏基因组分类的复杂层次结构中的相对丰度和置信度。Krona 将径向、空间填充显示与参数化着色和交互式极坐标缩放相结合。HTML5 和 JavaScript 的实现实现了完全交互式图表,可以使用任何现代 Web 浏览器进行探索,无需安装软件或插件。这种基于 Web 的架构还允许每个图表成为一个独立的文档,使其易于通过电子邮件共享或发布到标准 Web 服务器。为了说明 Krona 的实用性,我们描述了它在各种宏基因组数据集上的应用及其与流行的宏基因组分析工具的兼容性。
Krona 既是一种强大的宏基因组可视化工具,也是 HTML5 用于高度可访问的生物信息学可视化的潜力的展示。其丰富而交互式的显示有助于更明智地解释宏基因组分析,而其作为基于浏览器的应用程序的实现使其具有极高的便携性和易于被现有分析软件包采用。Krona 的渲染代码和转换工具都根据 BSD 开源许可证免费提供,并可从以下网址获得:http://krona.sourceforge.net。