Department of Urology, Yokohama City University Graduate School of Medicine, 3-9 Fukuura kanazawaku, Yokohama, 236-0004, Japan.
BMC Cancer. 2012 May 2;12:162. doi: 10.1186/1471-2407-12-162.
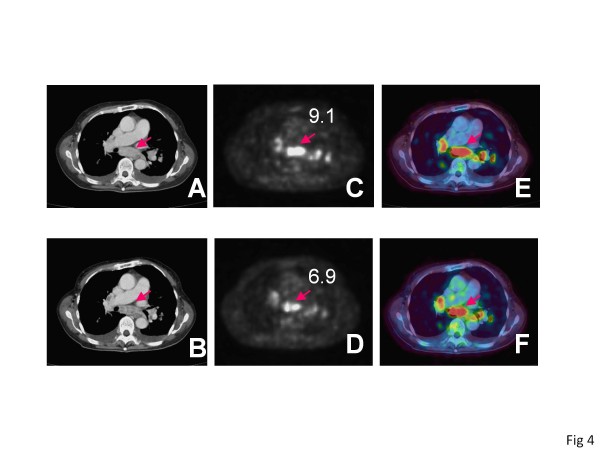
We reported previously that (18)F-2-fluoro-2-deoxyglucose positron emission tomography/ computed tomography (FDG PET/CT) had potential for evaluating early response to treatment by tyrosine kinase inhibitors (TKIs) in advanced renal cell carcinoma (RCC). This time we investigated the relation of the early assessment by FDG PET/CT to long-term prognosis with an expanded number of patients and period of observation.
Patients for whom TKI treatment for advanced RCC was planned were enrolled. FDG PET/CT was performed before TKI treatment and after one month of TKI treatment. The relations of the FDGPET/CT assessment to progression free survival (PFS) and overall survival (OS) were investigated.
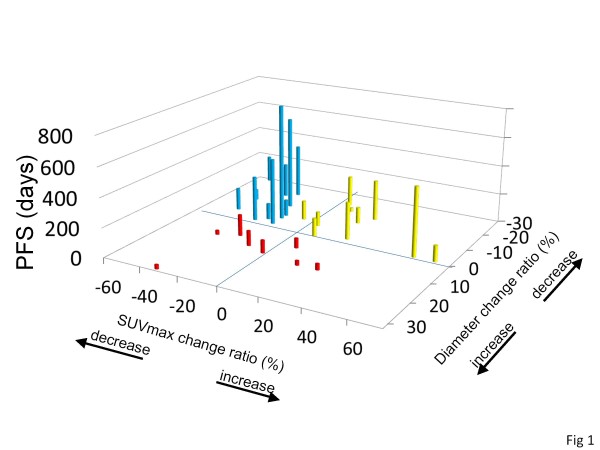
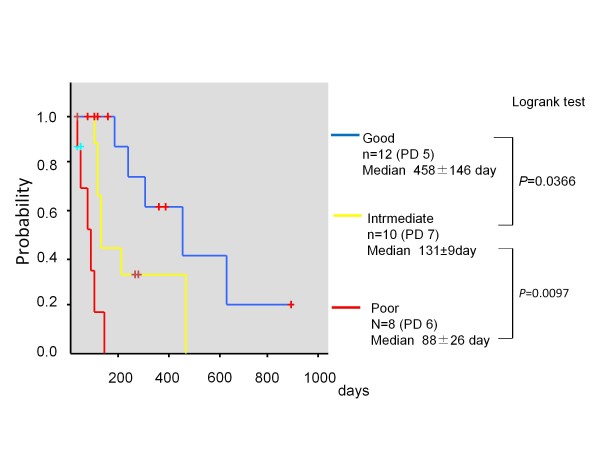
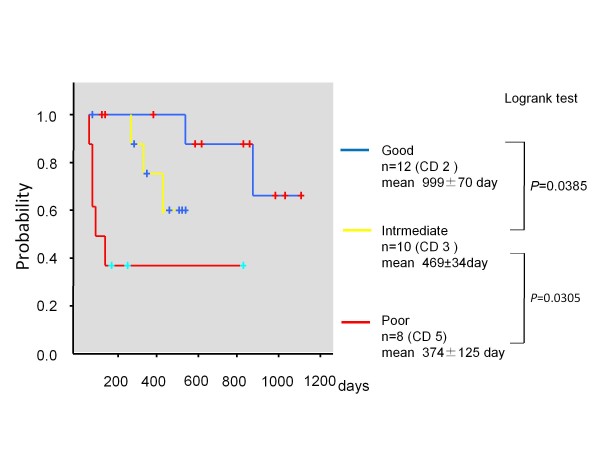
Thirty-five patients were enrolled (sunitinib 19 cases, sorafenib 16 cases). The patients with RCC showing high SUVmax in pretreatment FDG PET/CT demonstrated short PFS (P =0.024, hazard ratio 1.137, 95% CI 1.017-1.271) and short OS (P =0.004, hazard ratio 1.210 95% CI 1.062-1.379). Thirty patients (sunitinib 16 cases, sorafenib 14 cases) were evaluated again after 1 month. The PFS of the patients whose SUVmax decreased<20% was shorter than that of the patients whose SUVmax decreased<20% (P = 0.027, hazard ratio 3.043, 95% CI 1.134-8.167). The PFS of patients whose tumor diameter sum increased was shorter than that of the patient with tumors whose diameter sum did not (P =0.006, hazard ratio 4.555, 95% CI 1.543-13.448). The patients were classified into three response groups: good responder (diameter sum did not increase, and SUVmax decreased ≥ 20%), intermediate responder (diameter sum did not increase, and SUVmax decreased<20%), and poor responder (diameter sum increased, or one or more new lesions appeared). The median PFS of good, intermediate, and poor responders were 458 ± 146 days, 131 ± 9 days, and 88 ± 26 days (good vs. intermediate P = 0.0366, intermediate vs. poor P = 0.0097, log-rank test). Additionally the mean OSs were 999 ± 70 days, 469 ± 34 days, and 374 ± 125 days, respectively (good vs. intermediate P = 0.0385, intermediate vs. poor P = 0.0305, log-rank test).
The evaluation of RCC response to TKI by tumor size and FDG uptake using FDG PET/CT after 1 month can predict PFS and OS.
我们之前报道过(18)F-2-氟-2-脱氧葡萄糖正电子发射断层扫描/计算机断层扫描(FDG PET/CT)在晚期肾细胞癌(RCC)中具有通过酪氨酸激酶抑制剂(TKI)评估早期治疗反应的潜力。这一次,我们通过扩大患者数量和观察期,研究了 FDG PET/CT 的早期评估与长期预后之间的关系。
纳入计划接受 TKI 治疗的晚期 RCC 患者。在 TKI 治疗前和 TKI 治疗后一个月进行 FDG PET/CT 检查。研究了 FDG PET/CT 评估与无进展生存期(PFS)和总生存期(OS)的关系。
共纳入 35 例患者(舒尼替尼 19 例,索拉非尼 16 例)。在预处理 FDG PET/CT 中 SUVmax 较高的 RCC 患者表现出较短的 PFS(P =0.024,风险比 1.137,95%CI 1.017-1.271)和较短的 OS(P =0.004,风险比 1.210,95%CI 1.062-1.379)。30 例患者(舒尼替尼 16 例,索拉非尼 14 例)在 1 个月后再次接受评估。SUVmax 下降<20%的患者的 PFS 短于 SUVmax 下降<20%的患者(P =0.027,风险比 3.043,95%CI 1.134-8.167)。肿瘤直径总和增加的患者的 PFS 短于肿瘤直径总和未增加的患者(P =0.006,风险比 4.555,95%CI 1.543-13.448)。患者被分为三组:良好反应者(直径总和未增加,且 SUVmax 下降≥20%)、中等反应者(直径总和未增加,且 SUVmax 下降<20%)和不良反应者(直径总和增加,或出现一个或多个新病灶)。良好、中等和不良反应者的中位 PFS 分别为 458±146 天、131±9 天和 88±26 天(良好 vs. 中等 P=0.0366,中等 vs. 不良 P=0.0097,对数秩检验)。此外,平均 OS 分别为 999±70 天、469±34 天和 374±125 天(良好 vs. 中等 P=0.0385,中等 vs. 不良 P=0.0305,对数秩检验)。
在 TKI 治疗后 1 个月通过肿瘤大小和 FDG 摄取对 RCC 反应进行的 FDG PET/CT 评估可以预测 PFS 和 OS。