Department of Agricultural, Food and Nutritional Science, University of Alberta, Edmonton, AB T6G2P5, Canada.
BMC Genomics. 2012 May 23;13:202. doi: 10.1186/1471-2164-13-202.
Continued sequencing efforts coupled with advances in sequencing technology will lead to the completion of a vast number of small genomes. Whole-genome comparisons represent an important part of the analysis of any new genome sequence, as they can provide a better understanding of the biology and evolution of the source organism. Visualization of the results is important, as it allows information from a variety of sources to be integrated and interpreted. However, existing graphical comparison tools lack features needed for efficiently comparing a new genome to hundreds or thousands of existing sequences. Moreover, existing tools are limited in terms of the types of comparisons that can be performed, the extent to which the output can be customized, and the ease with which the entire process can be automated.
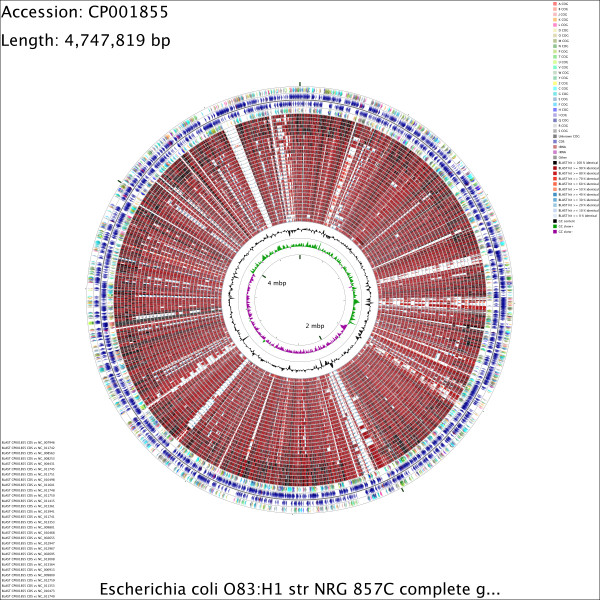
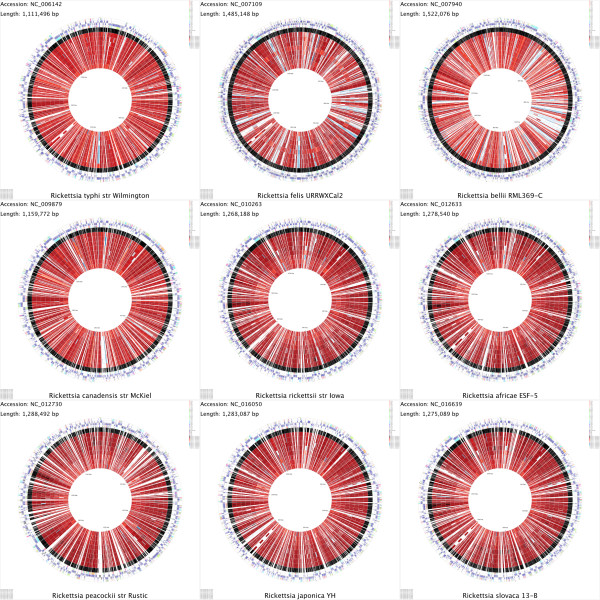
The CGView Comparison Tool (CCT) is a package for visually comparing bacterial, plasmid, chloroplast, or mitochondrial sequences of interest to existing genomes or sequence collections. The comparisons are conducted using BLAST, and the BLAST results are presented in the form of graphical maps that can also show sequence features, gene and protein names, COG (Clusters of Orthologous Groups of proteins) category assignments, and sequence composition characteristics. CCT can generate maps in a variety of sizes, including 400 Megapixel maps suitable for posters. Comparisons can be conducted within a particular species or genus, or all available genomes can be used. The entire map creation process, from downloading sequences to redrawing zoomed maps, can be completed easily using scripts included with the CCT. User-defined features or analysis results can be included on maps, and maps can be extensively customized. To simplify program setup, a CCT virtual machine that includes all dependencies preinstalled is available. Detailed tutorials illustrating the use of CCT are included with the CCT documentation.
CCT can be used to visually compare a reference sequence to thousands of existing genomes or sequence collections (next-generation sequencing reads for example) on a standard desktop computer. It provides analysis and visualization functionality not available in any existing circular genome visualization tool. By visually presenting sequence conservation information along with functional classifications and sequence composition characteristics, CCT can be a useful tool for identifying rapidly evolving or novel sequences, horizontally transferred sequences, or unusual functional properties in newly sequenced genomes. CCT is freely available for download at http://stothard.afns.ualberta.ca/downloads/CCT/.
随着测序工作的不断推进和测序技术的进步,将会完成大量小基因组的测序。全基因组比较是分析新基因组序列的重要组成部分,因为它可以更好地理解来源生物体的生物学和进化。结果的可视化很重要,因为它可以将来自各种来源的信息进行整合和解释。然而,现有的图形比较工具缺乏有效比较新基因组与数百或数千个现有序列所需的功能。此外,现有的工具在可以进行的比较类型、可以定制的输出程度以及整个过程自动化的难易程度方面都受到限制。
CGView 比较工具(CCT)是一个用于将感兴趣的细菌、质粒、叶绿体或线粒体序列与现有基因组或序列集进行可视化比较的软件包。比较是使用 BLAST 进行的,BLAST 结果以图形地图的形式呈现,还可以显示序列特征、基因和蛋白质名称、COG(同源蛋白簇)类别分配和序列组成特征。CCT 可以生成各种大小的地图,包括适合海报的 400 兆像素地图。比较可以在特定物种或属内进行,也可以使用所有可用的基因组。使用 CCT 随附的脚本可以轻松完成从下载序列到重新绘制缩放地图的整个地图创建过程。用户定义的特征或分析结果可以包含在地图上,并且可以对地图进行广泛的自定义。为了简化程序设置,提供了一个包含所有预安装依赖项的 CCT 虚拟机。CCT 文档中包含了说明如何使用 CCT 的详细教程。
CCT 可用于在标准台式计算机上将参考序列与数千个现有基因组或序列集(例如下一代测序读取)进行可视化比较。它提供了任何现有圆形基因组可视化工具都不具备的分析和可视化功能。通过沿功能分类和序列组成特征直观呈现序列保守性信息,CCT 可以成为识别快速进化或新颖序列、水平转移序列或新测序基因组中异常功能特性的有用工具。CCT 可在 http://stothard.afns.ualberta.ca/downloads/CCT/ 免费下载。