Graduate School of Comprehensive Human Sciences, University of Tsukuba, 1-1-1 Tennodai, Tsukuba, Ibaraki, 305-8577, Japan.
Nutr Metab (Lond). 2012 Jun 14;9:56. doi: 10.1186/1743-7075-9-56.
Although the measurement site at L4-L5 for visceral adipose tissue (VAT) has been commonly accepted, some researchers suggest that additional upper sites (i.e., L1-L2 and L2-L3) are useful for estimating VAT volume. Therefore, determining the optimum measurement site remains challenging and has become important in determining VAT volume. We investigated the influence of a single-slice measurement site on the prediction of VAT volume and changes in VAT volume in obese Japanese men.
Twenty-four men, aged 30-65 years with a mean BMI of 30 kg/m2, were included in a 12-week weight loss program. We obtained continuous T1-weighted abdominal magnetic resonance images from T9 to S1 with a 1.5-T system to measure the VAT area. These VAT areas were then summed to determine VAT volume before and after the program.
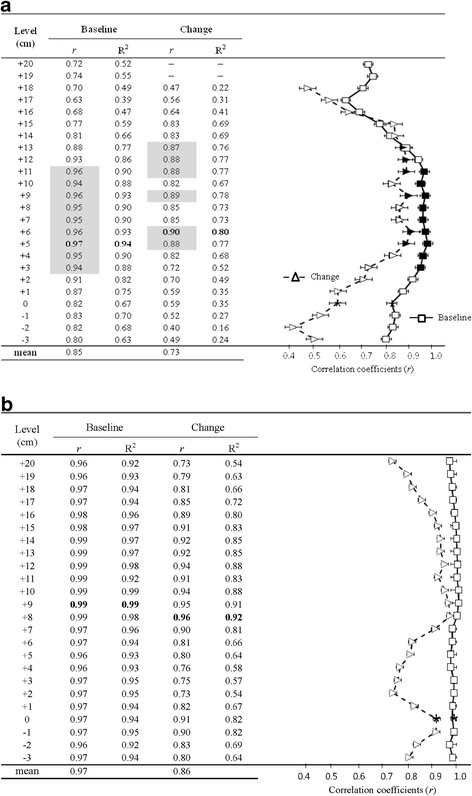
Single-slice images at 3-11 cm above L4-L5 had significant and high correlations with VAT volume at baseline (r=0.94-0.97). The single-slice image with the highest correlation coefficient with respect to VAT volume was located at 5 cm above L4-L5 (r=0.97). The highest correlation coefficient between the individual changes in VAT area and changes in VAT volume was located at 6 cm above L4-L5 (r=0.90).
Individual measurement sites have different abilities to estimate VAT volume and changes in VAT volume in obese Japanese men. Best zone located at 5-6 cm above L4-L5 may be a better predictor of VAT volume than the L4-L5 image in terms of both baseline and changes with weight loss.
尽管 L4-L5 节段已被广泛用于测量内脏脂肪组织(VAT),但一些研究人员认为额外的上节段(即 L1-L2 和 L2-L3)对于估计 VAT 体积也很有用。因此,确定最佳的测量部位仍然具有挑战性,并且对于确定 VAT 体积变得很重要。我们研究了单点测量部位对肥胖日本男性 VAT 体积预测和 VAT 体积变化的影响。
我们纳入了 24 名年龄在 30-65 岁、平均 BMI 为 30kg/m2 的男性,他们参与了为期 12 周的减重计划。我们使用 1.5-T 系统从 T9 到 S1 连续获得腹部 T1 加权磁共振图像,以测量 VAT 面积。然后将这些 VAT 面积相加,以确定减重计划前后的 VAT 体积。
L4-L5 上方 3-11cm 的单点图像与基线时的 VAT 体积具有显著的高度相关性(r=0.94-0.97)。与 VAT 体积相关性最高的单点图像位于 L4-L5 上方 5cm(r=0.97)。与 VAT 面积个体变化与 VAT 体积变化之间相关性最高的是 L4-L5 上方 6cm(r=0.90)。
在肥胖的日本男性中,单点测量部位对 VAT 体积和 VAT 体积变化的估计能力不同。最佳区域位于 L4-L5 上方 5-6cm,与基线和减重时的变化相比,可能比 L4-L5 图像更能预测 VAT 体积。