Division of Epidemiology & Community Health, School of Public Health, University of Minnesota, 1300 2nd Street S, Suite #300, Minneapolis, MN 55455, USA.
BMC Pediatr. 2012 Jul 23;12:104. doi: 10.1186/1471-2431-12-104.
The new growth charts in the UK, the UK-WHO charts, comprise prescriptive data from the WHO standard between two weeks and four years of age. Little is known about the development of obesity risk in normal UK infants, who are necessarily not fed according to the WHO recommendations and do not live in constraint-free environments (the selection criteria of the WHO standard source sample), using the new charts. Here, we investigated infant growth trajectories and traits indicative of childhood obesity using the UK-WHO charts, with the aim to clearly document the implications of adopting the new charts on UK growth monitoring practice.
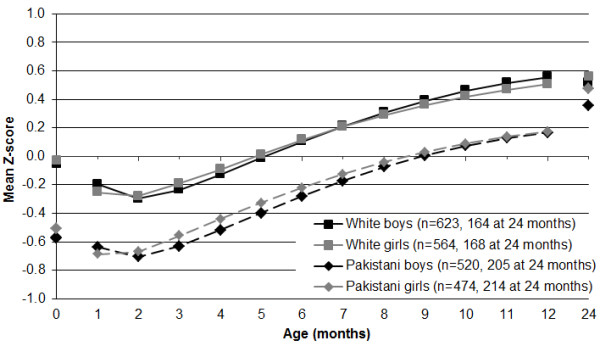
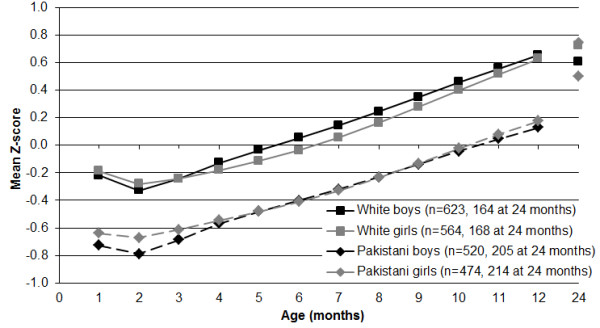
Mixed effects models were applied to serial weight and length data from 2181 infants (1187 White; 994 Pakistani) in the Born in Bradford birth cohort study to produce curves from 10 days to 15 months of age. Individual monthly estimates were converted to Z-scores and were plotted by sex and ethnic group. The relative risks (RR) of traits indicative of childhood obesity, including high BMI and rapid weight gain, using the UK-WHO charts compared to the previously used UK90 reference were calculated for all infants together and for White and Pakistani infants separately.
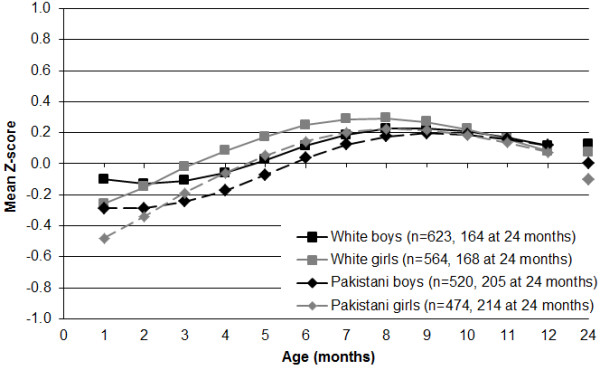
Both ethnic groups demonstrated patterns of growth similar to the UK-WHO charts in length but not in weight. The resulting pattern for BMI was remarkable, with an average gain of 1.0 Z-score between two and 12 months of age. The UK-WHO charts were significantly (p < 0.05) more likely than the UK90 reference to classify BMI above the 91st centile after age six months (RR 1.427-2.151) and weight and BMI gain between birth (one month for BMI) and 12 months of age greater than two centile bands (RR 1.214 and 1.470, respectively).
The change to the UK-WHO charts means that normal UK infants risk being diagnosed as being on a trajectory toward childhood obesity. National estimates of obesity will have to be recalculated for previous years to allow longitudinal comparison. The new charts do not allow a focused prevention effort for targeting programmes at infants most at risk of becoming obese, because the use of the 91st or 98th centile on the UK-WHO charts will identify many more infants as being at risk than the same centiles on the UK90 reference. Now more than ever, research is needed to develop a large scale childhood obesity prevention programme which could ideally be integrated with routine infant growth monitoring practice.
英国新的生长图表,即 UK-WHO 图表,包含了世卫组织标准中从两周到四岁之间的规定性数据。对于英国正常婴儿的肥胖风险发育情况,我们知之甚少,因为这些婴儿不可能按照世卫组织的建议进行喂养,而且他们的生活环境也不是无约束的(世卫组织标准源样本的选择标准),因此无法使用新的图表。在这里,我们使用 UK-WHO 图表研究了英国婴儿的生长轨迹和肥胖特征,目的是明确记录采用新图表对英国生长监测实践的影响。
混合效应模型应用于布拉德福德出生队列研究中 2181 名婴儿(1187 名白人;994 名巴基斯坦人)的连续体重和长度数据,以生成从 10 天到 15 个月的曲线。个体每月的估计值被转换为 Z 分数,并按性别和种族群体进行绘制。使用 UK-WHO 图表计算了所有婴儿以及白人和巴基斯坦婴儿的肥胖特征(包括高 BMI 和体重快速增加)的相对风险(RR),与之前使用的 UK90 参考值进行比较。
两个种族群体的长度生长模式与 UK-WHO 图表相似,但体重生长模式不同。BMI 的结果非常显著,在 2 至 12 个月之间平均增加了 1.0 个 Z 分数。UK-WHO 图表在六个月后(RR 1.427-2.151)和出生至 12 个月期间体重和 BMI 增长超过两个百分位带(RR 1.214 和 1.470)时,将 BMI 分类为 91 百分位以上的可能性明显高于 UK90 参考值(RR 1.427-2.151)。
改用 UK-WHO 图表意味着英国正常婴儿有被诊断为肥胖轨迹的风险。为了进行纵向比较,之前年份的肥胖国家估计值将不得不重新计算。新图表不能将重点放在预防措施上,因为针对最有可能肥胖的婴儿的计划,因为使用 UK-WHO 图表的 91 百分位或 98 百分位会比使用 UK90 参考值识别出更多处于风险中的婴儿。现在比以往任何时候都更需要研究来制定一个大规模的儿童肥胖预防计划,该计划可以理想地与常规婴儿生长监测实践相结合。