Neurology Department, Golestan Hospital, Ahvaz Jundishapur University of Medical Sciences, Ahvaz, Iran.
BMC Neurol. 2012 Sep 24;12:100. doi: 10.1186/1471-2377-12-100.
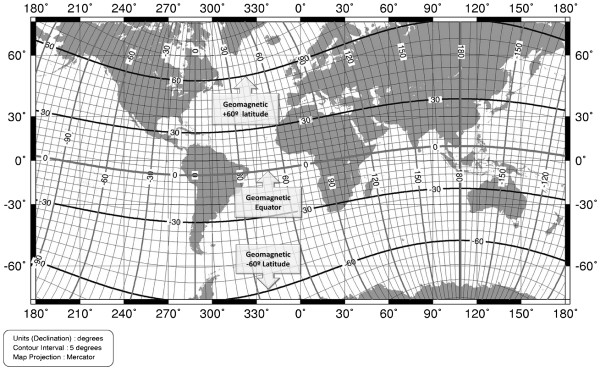
We noticed that a hypothesis based on the effect of geomagnetic disturbances (GMD) has the ability to explain special features of multiple sclerosis (MS). Areas around geomagnetic 60 degree latitude (GM60L) experience the greatest amount of GMD. The easiest way to evaluate our hypothesis was to test the association of MS prevalence (MSP) with angular distance to geomagnetic 60 degree latitude (AMAG60) and compare it with the known association of MS with geographical latitude (GL). We did the same with angular distance to geographic 60 degree latitude (AGRAPH60) as a control.
English written papers with MSP keywords, done in Europe (EUR), North America (NA) or Australasia (AUS) were retrieved from the PubMed. Geomagnetic coordinates were determined for each location and AMAG60 was calculated as absolute value of numerical difference between its geomagnetic latitude from GM60L. By an ecological study with using meta-regression analyses, the relationship of MSP with GL, AMAG60 and AGRAPH60 were evaluated separately. MSP data were weighted by square root of number of prevalent cases. Models were compared by their adjusted R square (AR2) and standard error of estimate (SEE).
111 MSP data were entered in the study. In each continent, AMAG60 had the best correlation with MSP, the largest AR2 (0.47, 0.42 and 0.84 for EUR, NA and AUS, respectively) and the least SEE. Merging both hemispheres data, AMAG60 explained 56% of MSP variations with the least SEE (R = 0.75, AR2 = 0.56, SEE = 57), while GL explained 17% (R = 0.41, AR2 = 0.17, SEE = 78.5) and AGRAPH60 explained 12% of that variations with the highest SEE (R = 0.35, AR2 = 0.12, SEE = 80.5).
Our results confirmed that AMAG60 is the best describer of MSP variations and has the strongest association with MSP distribution. They clarified that the well-known latitudinal gradient of MSP may be actually a gradient related to GM60L. Moreover, the location of GM60L can elucidate why MSP has parabolic and linear gradient in the north and south hemisphere, respectively. This preliminary evaluation supported that GMD can be the mysterious environmental risk factor for MS. We believe that this hypothesis deserves to be considered for further validation studies.
我们注意到,基于地磁干扰(GMD)效应的假设能够解释多发性硬化症(MS)的一些特殊特征。地磁 60 度纬度(GM60L)周围的区域经历了最大量的 GMD。评估我们假设的最简单方法是测试 MS 患病率(MSP)与地磁 60 度纬度角距(AMAG60)的关联,并将其与已知的 MS 与地理纬度(GL)的关联进行比较。我们还对地理 60 度纬度角距(AGRAPH60)进行了相同的比较作为对照。
从 PubMed 中检索了具有 MSP 关键字的英文文献,这些文献来自欧洲(EUR)、北美(NA)或澳大拉西亚(AUS)。为每个地点确定了地磁坐标,并计算了 AMAG60,即其地磁纬度与 GM60L 之间数值差的绝对值。通过使用元回归分析的生态研究,分别评估了 MSP 与 GL、AMAG60 和 AGRAPH60 的关系。MSP 数据通过患病率病例数的平方根进行加权。通过调整后的 R 平方(AR2)和估计标准误差(SEE)来比较模型。
共有 111 项 MSP 数据纳入研究。在每个大陆,AMAG60 与 MSP 的相关性最好,AR2 最大(EUR、NA 和 AUS 分别为 0.47、0.42 和 0.84),SEE 最小。合并两个半球的数据,AMAG60 用最小的 SEE 解释了 56%的 MSP 变化(R = 0.75,AR2 = 0.56,SEE = 57),而 GL 解释了 17%(R = 0.41,AR2 = 0.17,SEE = 78.5),AGRAPH60 用最高的 SEE 解释了 12%的变化(R = 0.35,AR2 = 0.12,SEE = 80.5)。
我们的结果证实 AMAG60 是 MSP 变化的最佳描述符,与 MSP 分布的关联最强。它们澄清了众所周知的 MSP 纬度梯度可能实际上是与 GM60L 相关的梯度。此外,GM60L 的位置可以解释为什么 MSP 在北半球和南半球分别呈抛物线和线性梯度。这种初步评估支持 GMD 可能是 MS 的神秘环境风险因素。我们相信,这个假设值得进一步验证研究。