• 文献检索
  • 文档翻译
  • 深度研究
  • 学术资讯
  • Suppr Zotero 插件Zotero 插件
  • 邀请有礼
  • 套餐&价格
  • 历史记录
应用&插件
Suppr Zotero 插件Zotero 插件浏览器插件Mac 客户端Windows 客户端微信小程序
定价
高级版会员购买积分包购买API积分包
服务
文献检索文档翻译深度研究API 文档MCP 服务
关于我们
关于 Suppr公司介绍联系我们用户协议隐私条款
关注我们

Suppr 超能文献

核心技术专利:CN118964589B侵权必究
粤ICP备2023148730 号-1Suppr @ 2026

文献检索

告别复杂PubMed语法,用中文像聊天一样搜索,搜遍4000万医学文献。AI智能推荐,让科研检索更轻松。

立即免费搜索

文件翻译

保留排版,准确专业,支持PDF/Word/PPT等文件格式,支持 12+语言互译。

免费翻译文档

深度研究

AI帮你快速写综述,25分钟生成高质量综述,智能提取关键信息,辅助科研写作。

立即免费体验

比较成年加拿大人的体重指数类别与预期寿命和健康调整预期寿命:描述性研究。

Comparing life expectancy and health-adjusted life expectancy by body mass index category in adult Canadians: a descriptive study.

机构信息

Public Health Agency of Canada, 200, boulevard René-Lévesque Ouest, Montréal, QC H2Z 1X4, Canada.

出版信息

Popul Health Metr. 2013 Nov 19;11(1):21. doi: 10.1186/1478-7954-11-21.

DOI:10.1186/1478-7954-11-21
PMID:24252500
原文链接:https://pmc.ncbi.nlm.nih.gov/articles/PMC3842774/
Abstract

BACKGROUND

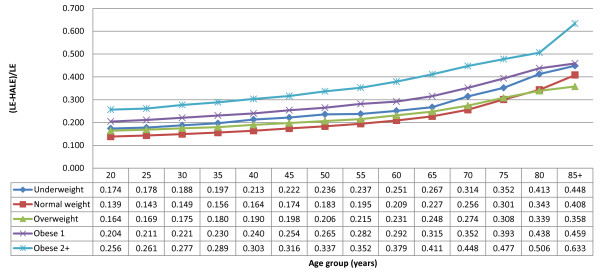
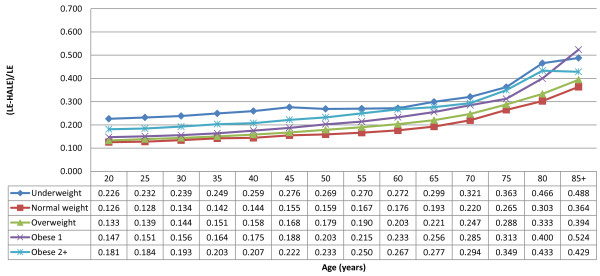
While many studies have examined differences between body mass index (BMI) categories in terms of mortality risk and health-related quality of life (HRQL), little is known about the effect of body weight on health expectancy. We examined life expectancy (LE), health-adjusted life expectancy (HALE), and proportion of LE spent in nonoptimal (or poor) health by BMI category for the Canadian adult population (age ≥ 20).

METHODS

Respondents to the National Population Health Survey (NPHS) were followed for mortality outcomes from 1994 to 2009. Our study population at baseline (n=12,478) was 20 to 100 years old with an average age of 47. LE was produced by building abridged life tables by sex and BMI category using data from the NPHS and the Canadian Chronic Disease Surveillance System. HALE was estimated using the Health Utilities Index from the Canadian Community Health Survey as a measure of HRQL. The contribution of HRQL to loss of healthy life years for each BMI category was also assessed using two methods: by calculating differences between LE and HALE proportional to LE and by using a decomposition technique to separate out mortality and HRQL contributions to loss of HALE.

RESULTS

At age 20, for both sexes, LE is significantly lower in the underweight and obesity class 2+ categories, but significantly higher in the overweight category when compared to normal weight (obesity class 1 was nonsignificant). HALE at age 20 follows these same associations and is significantly lower for class 1 obesity in women. Proportion of life spent in nonoptimal health and decomposition of HALE demonstrate progressively higher losses of healthy life associated with lowered HRQL for BMI categories in excess of normal weight.

CONCLUSIONS

Although being in the overweight category for adults may be associated with a gain in life expectancy as compared to normal weight adults, overweight individuals also experience a higher proportion of these years of life in poorer health. Due to the descriptive nature of this study, further research is needed to explore the causal mechanisms which explain these results, including the important differences we observed between sexes and within obesity subcategories.

摘要

背景

虽然许多研究已经检查了身体质量指数 (BMI) 类别在死亡率风险和健康相关生活质量 (HRQL) 方面的差异,但对于体重对健康预期寿命的影响知之甚少。我们检查了加拿大成年人口(年龄≥20 岁)的预期寿命 (LE)、健康调整后的预期寿命 (HALE) 和非最佳 (或较差) 健康状态的 LE 比例,按 BMI 类别进行划分。

方法

从 1994 年到 2009 年,对国家人口健康调查 (NPHS) 的受访者进行了死亡率结果的随访。我们的基线研究人群(n=12478)年龄在 20 至 100 岁之间,平均年龄为 47 岁。通过使用 NPHS 和加拿大慢性疾病监测系统的数据,为男性和 BMI 类别构建简化生命表来生成 LE。使用加拿大社区健康调查的健康效用指数作为 HRQL 的衡量标准来估计 HALE。还使用两种方法评估每个 BMI 类别中 HRQL 对健康生命年损失的贡献:通过计算 LE 和 HALE 之间与 LE 成比例的差异,以及使用分解技术将死亡率和 HRQL 对 HALE 损失的贡献分开。

结果

在 20 岁时,对于两性,与正常体重相比,体重不足和肥胖 2+类别的 LE 显著降低,但超重类别的 LE 显著升高(肥胖 1 类无显著差异)。20 岁时的 HALE 遵循相同的关联,女性肥胖 1 类的 HALE 显著降低。非最佳健康状态的比例和 HALE 的分解表明,与正常体重成年人相比,BMI 类别超过正常体重与较低的 HRQL 相关,健康生命年的损失更高。

结论

虽然与正常体重成年人相比,成年人处于超重类别可能与预期寿命的增加有关,但超重人群也经历了更高比例的这些生命年处于较差的健康状态。由于本研究的描述性性质,需要进一步研究来探索解释这些结果的因果机制,包括我们在性别和肥胖亚类别内观察到的重要差异。

https://cdn.ncbi.nlm.nih.gov/pmc/blobs/9962/3842774/451580a6f644/1478-7954-11-21-2.jpg
https://cdn.ncbi.nlm.nih.gov/pmc/blobs/9962/3842774/8a10603585a2/1478-7954-11-21-1.jpg
https://cdn.ncbi.nlm.nih.gov/pmc/blobs/9962/3842774/451580a6f644/1478-7954-11-21-2.jpg
https://cdn.ncbi.nlm.nih.gov/pmc/blobs/9962/3842774/8a10603585a2/1478-7954-11-21-1.jpg
https://cdn.ncbi.nlm.nih.gov/pmc/blobs/9962/3842774/451580a6f644/1478-7954-11-21-2.jpg

相似文献

1
Comparing life expectancy and health-adjusted life expectancy by body mass index category in adult Canadians: a descriptive study.比较成年加拿大人的体重指数类别与预期寿命和健康调整预期寿命:描述性研究。
Popul Health Metr. 2013 Nov 19;11(1):21. doi: 10.1186/1478-7954-11-21.
2
Describing the population health burden of depression: health-adjusted life expectancy by depression status in Canada.描述抑郁症对人群健康的负担:加拿大按抑郁症状况调整的健康预期寿命。
Health Promot Chronic Dis Prev Can. 2016 Oct;36(10):205-213. doi: 10.24095/hpcdp.36.10.01.
3
Evaluating compression or expansion of morbidity in Canada: trends in life expectancy and health-adjusted life expectancy from 1994 to 2010.评估加拿大发病(残障)率的压缩或膨胀:1994 年至 2010 年期间预期寿命和健康调整预期寿命的趋势。
Health Promot Chronic Dis Prev Can. 2017 Mar;37(3):68-76. doi: 10.24095/hpcdp.37.3.02.
4
Impact of diabetes mellitus on life expectancy and health-adjusted life expectancy in Canada.糖尿病对加拿大预期寿命和健康调整预期寿命的影响。
Popul Health Metr. 2012 Apr 24;10(1):7. doi: 10.1186/1478-7954-10-7.
5
Estimating health-adjusted life expectancy conditional on risk factors: results for smoking and obesity.基于风险因素估算健康调整生命预期:吸烟与肥胖的结果
Popul Health Metr. 2006 Nov 3;4:14. doi: 10.1186/1478-7954-4-14.
6
Changes and Trend Disparities in Life Expectancy and Health-Adjusted Life Expectancy Attributed to Disability and Mortality From 1990 to 2019 in China.1990 年至 2019 年中国归因于残疾和死亡的预期寿命和健康调整预期寿命的变化及趋势差异。
Front Public Health. 2022 Jul 18;10:925114. doi: 10.3389/fpubh.2022.925114. eCollection 2022.
7
Divergences and gaps in life expectancy and health-adjusted life expectancy in Mexico: Contribution analysis of the Global Burden of Disease Study 2019.墨西哥在预期寿命和健康调整预期寿命方面的差异和差距:2019 年全球疾病负担研究的贡献分析。
PLoS One. 2023 Nov 6;18(11):e0293881. doi: 10.1371/journal.pone.0293881. eCollection 2023.
8
Physical activity, body mass index, and health-related quality of life in Canadian adults.加拿大成年人的身体活动、体重指数与健康相关生活质量。
Med Sci Sports Exerc. 2012 Apr;44(4):625-36. doi: 10.1249/MSS.0b013e31823a90ae.
9
Disability-Adjusted Life-Years (DALYs) for 315 Diseases and Injuries and Healthy Life Expectancy (HALE) in Iran and its Neighboring Countries, 1990-2015: Findings from Global Burden of Disease Study 2015.1990 - 2015年伊朗及其邻国315种疾病和损伤的伤残调整生命年(DALYs)及健康预期寿命(HALE):全球疾病负担研究2015的结果
Arch Iran Med. 2017 Jul;20(7):403-418.
10
Body mass index as a predictor of healthy and disease-free life expectancy between ages 50 and 75: a multicohort study.体重指数作为50至75岁健康无病预期寿命的预测指标:一项多队列研究
Int J Obes (Lond). 2017 May;41(5):769-775. doi: 10.1038/ijo.2017.29. Epub 2017 Jan 31.

引用本文的文献

1
Global and regional impact of health determinants on life expectancy and health-adjusted life expectancy, 2000-2018: an econometric analysis based on the Global Burden of Disease study 2019.2000 - 2018年健康决定因素对预期寿命和健康调整生命预期的全球及区域影响:基于2019年全球疾病负担研究的计量经济学分析
Front Public Health. 2025 Apr 17;13:1566469. doi: 10.3389/fpubh.2025.1566469. eCollection 2025.
2
Associations Between Mid- to Late-Life Body Mass Index and Chronic Disease-Free Survival: A Nationwide Twin Study.中年至晚年体重指数与无慢性病生存时间的关联:一项全国性双胞胎研究。
J Gerontol A Biol Sci Med Sci. 2024 Jan 1;79(1). doi: 10.1093/gerona/glad111.
3

本文引用的文献

1
On the Estimation of Disability-Free Life Expectancy: Sullivan' Method and Its Extension.论无残疾预期寿命的估计:沙利文方法及其扩展
J Am Stat Assoc. 2007 Fall;102(480):1199-1211. doi: 10.1198/016214507000000040.
2
Does body mass index adequately convey a patient's mortality risk?体重指数能否充分反映患者的死亡风险?
JAMA. 2013 Jan 2;309(1):87-8. doi: 10.1001/jama.2012.185445.
3
Association of all-cause mortality with overweight and obesity using standard body mass index categories: a systematic review and meta-analysis.
Converting health risks into loss of life years - a paradigm shift in clinical risk communication.
将健康风险转化为生命损失年——临床风险沟通中的范式转变。
Aging (Albany NY). 2021 Sep 7;13(17):21513-21525. doi: 10.18632/aging.203491.
4
Health-adjusted life expectancy (HALE) in Chongqing, China, 2017: An artificial intelligence and big data method estimating the burden of disease at city level.2017年中国重庆的健康调整生命预期(HALE):一种利用人工智能和大数据方法对城市层面疾病负担进行估算的研究
Lancet Reg Health West Pac. 2021 Mar 2;9:100110. doi: 10.1016/j.lanwpc.2021.100110. eCollection 2021 Apr.
5
Comparative Methodologic and Practical Considerations for Life Expectancy as a Public Health Mortality Measure.作为公共卫生死亡率衡量指标的预期寿命的比较方法学和实际考虑因素。
Public Health Rep. 2022 Mar-Apr;137(2):255-262. doi: 10.1177/0033354921999407. Epub 2021 Mar 11.
6
The Impact of Smoking and Obesity on Disability-Free Life Expectancy in Older Australians.吸烟和肥胖对澳大利亚老年人无残疾预期寿命的影响。
J Gerontol A Biol Sci Med Sci. 2021 Jun 14;76(7):1265-1272. doi: 10.1093/gerona/glaa290.
7
Assessment of the burden of diseases and injuries attributable to risk factors in Canada from 1990 to 2016: an analysis of the Global Burden of Disease Study.1990年至2016年加拿大可归因于风险因素的疾病和伤害负担评估:全球疾病负担研究分析
CMAJ Open. 2019 Feb 28;7(1):E140-E148. doi: 10.9778/cmajo.20180137. Print 2019 Jan-Mar.
8
Period Life Tables for Calculating Life Expectancy: Options to Assess and Minimize the Potential for Bias.用于计算预期寿命的时期生命表:评估和最小化偏差可能性的选项。
Am J Public Health. 2018 Mar;108(3):e14. doi: 10.2105/AJPH.2017.304268.
9
Standard Period Life Table Used to Compute the Life Expectancy of Diseased Subpopulations: More Confusing Than Helpful.用于计算患病亚人群预期寿命的标准时期生命表:困惑多于帮助。
Am J Public Health. 2017 Oct;107(10):1615-1620. doi: 10.2105/AJPH.2017.303932. Epub 2017 Aug 17.
10
Body mass index as a predictor of healthy and disease-free life expectancy between ages 50 and 75: a multicohort study.体重指数作为50至75岁健康无病预期寿命的预测指标:一项多队列研究
Int J Obes (Lond). 2017 May;41(5):769-775. doi: 10.1038/ijo.2017.29. Epub 2017 Jan 31.
采用标准体重指数类别评估全因死亡率与超重和肥胖的关联:系统评价和荟萃分析。
JAMA. 2013 Jan 2;309(1):71-82. doi: 10.1001/jama.2012.113905.
4
Obesity paradox or inappropriate study designs? Time for life-course epidemiology.肥胖悖论还是不恰当的研究设计?是时候进行生命历程流行病学研究了。
J Hypertens. 2012 Dec;30(12):2271-5. doi: 10.1097/HJH.0b013e32835b4fe0.
5
Body mass index, diabetes, hypertension, and short-term mortality: a population-based observational study, 2000-2006.体重指数、糖尿病、高血压与短期死亡率:基于人群的观察性研究,2000-2006 年。
J Am Board Fam Med. 2012 Jul-Aug;25(4):422-31. doi: 10.3122/jabfm.2012.04.110289.
6
Body mass index and risk of cardiovascular disease, cancer and all-cause mortality.体重指数与心血管疾病、癌症和全因死亡率的风险。
Can J Public Health. 2012 Mar-Apr;103(2):147-51. doi: 10.1007/BF03404221.
7
The association between waist circumference and risk of mortality considering body mass index in 65- to 74-year-olds: a meta-analysis of 29 cohorts involving more than 58 000 elderly persons.考虑到 65 至 74 岁人群的体重指数,腰围与死亡率风险的关系:涉及 58000 多名老年人的 29 项队列研究的荟萃分析。
Int J Epidemiol. 2012 Jun;41(3):805-17. doi: 10.1093/ije/dys008. Epub 2012 Mar 31.
8
Repeated measures of body mass index and risk of health related outcomes.体重指数的重复测量与健康相关结局的风险。
Eur J Epidemiol. 2012 Mar;27(3):215-24. doi: 10.1007/s10654-012-9669-7. Epub 2012 Mar 3.
9
Bias in self-reported estimates of obesity in Canadian health surveys: an update on correction equations for adults.加拿大健康调查中自我报告肥胖估计的偏倚:成人校正方程的更新。
Health Rep. 2011 Sep;22(3):35-45.
10
Bodyweight, gender, and quality of life: a population-based longitudinal study.体重、性别与生活质量:基于人群的纵向研究。
Qual Life Res. 2012 Jun;21(5):813-25. doi: 10.1007/s11136-011-9989-1. Epub 2011 Aug 13.