University Hospital Center, Institute of Social and Preventive Medicine (IUMSP), University of Lausanne , Lausanne , Switzerland ; Department of Epidemiology, Biostatistics, and Occupational Health, McGill University , Montreal, QC , Canada.
Department of Epidemiology, Biostatistics, and Occupational Health, McGill University , Montreal, QC , Canada ; McGill University Health Center Research Institute , Montreal, QC , Canada ; Public Health Institute of Quebec , Montreal, QC , Canada.
Front Public Health. 2013 Aug 23;1:29. doi: 10.3389/fpubh.2013.00029. eCollection 2013.
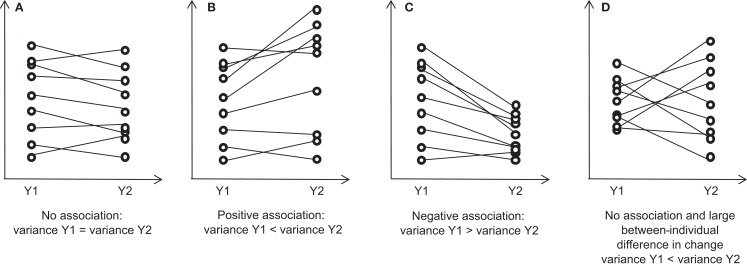
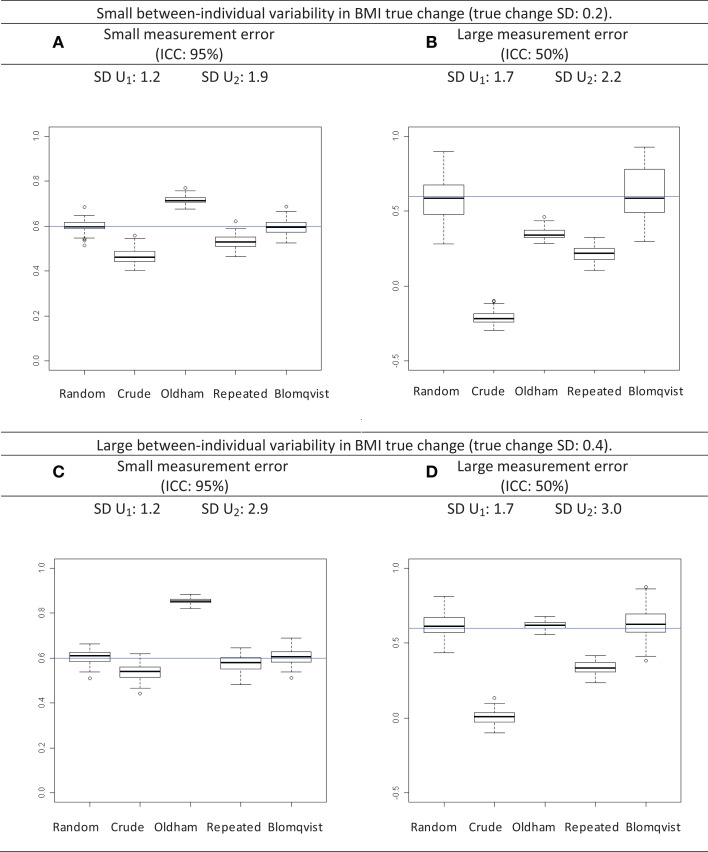
Analyzing the relationship between the baseline value and subsequent change of a continuous variable is a frequent matter of inquiry in cohort studies. These analyses are surprisingly complex, particularly if only two waves of data are available. It is unclear for non-biostatisticians where the complexity of this analysis lies and which statistical method is adequate. With the help of simulated longitudinal data of body mass index in children, we review statistical methods for the analysis of the association between the baseline value and subsequent change, assuming linear growth with time. Key issues in such analyses are mathematical coupling, measurement error, variability of change between individuals, and regression to the mean. Ideally, it is better to rely on multiple repeated measurements at different times and a linear random effects model is a standard approach if more than two waves of data are available. If only two waves of data are available, our simulations show that Blomqvist's method - which consists in adjusting for measurement error variance the estimated regression coefficient of observed change on baseline value - provides accurate estimates. The adequacy of the methods to assess the relationship between the baseline value and subsequent change depends on the number of data waves, the availability of information on measurement error, and the variability of change between individuals.
分析连续变量的基线值与后续变化之间的关系是队列研究中常见的问题。这些分析非常复杂,特别是如果只有两波数据可用时。非生物统计学家不清楚这种分析的复杂性在哪里,也不知道哪种统计方法是足够的。我们借助儿童体重指数的模拟纵向数据,回顾了分析基线值与后续变化之间关联的统计方法,假设随时间线性增长。此类分析中的关键问题是数学耦合、测量误差、个体间变化的可变性以及向均值回归。理想情况下,最好依靠不同时间的多次重复测量,如果有超过两波数据,则线性随机效应模型是一种标准方法。如果只有两波数据可用,我们的模拟结果表明,Blomqvist 方法——即通过调整测量误差方差来调整观测到的变化对基线值的估计回归系数——可以提供准确的估计。评估基线值与后续变化之间关系的方法的适当性取决于数据波数、测量误差信息的可用性以及个体间变化的可变性。