• 文献检索
  • 文档翻译
  • 深度研究
  • 学术资讯
  • Suppr Zotero 插件Zotero 插件
  • 邀请有礼
  • 套餐&价格
  • 历史记录
应用&插件
Suppr Zotero 插件Zotero 插件浏览器插件Mac 客户端Windows 客户端微信小程序
定价
高级版会员购买积分包购买API积分包
服务
文献检索文档翻译深度研究API 文档MCP 服务
关于我们
关于 Suppr公司介绍联系我们用户协议隐私条款
关注我们

Suppr 超能文献

核心技术专利:CN118964589B侵权必究
粤ICP备2023148730 号-1Suppr @ 2026

文献检索

告别复杂PubMed语法,用中文像聊天一样搜索,搜遍4000万医学文献。AI智能推荐,让科研检索更轻松。

立即免费搜索

文件翻译

保留排版,准确专业,支持PDF/Word/PPT等文件格式,支持 12+语言互译。

免费翻译文档

深度研究

AI帮你快速写综述,25分钟生成高质量综述,智能提取关键信息,辅助科研写作。

立即免费体验

科学家从表达数据中假设疾病机制时的意义建构及其对可视化支持的需求。

Scientists' sense making when hypothesizing about disease mechanisms from expression data and their needs for visualization support.

机构信息

School of Education, University of Michigan, Ann Arbor, Michigan 48109, USA.

出版信息

BMC Bioinformatics. 2014 Apr 26;15:117. doi: 10.1186/1471-2105-15-117.

DOI:10.1186/1471-2105-15-117
PMID:24766796
原文链接:https://pmc.ncbi.nlm.nih.gov/articles/PMC4021544/
Abstract

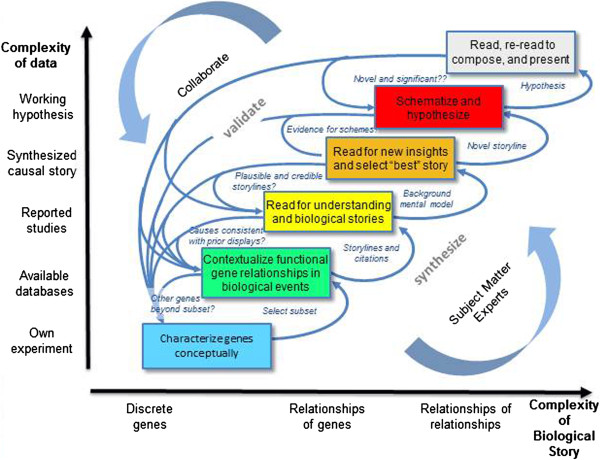
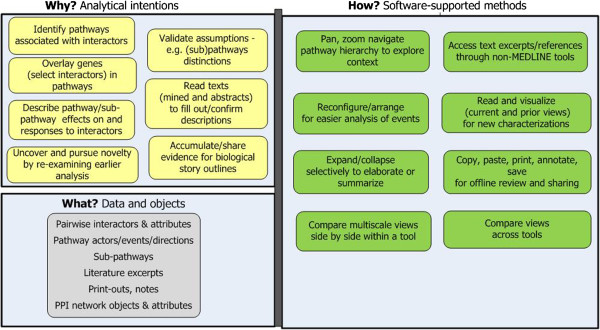
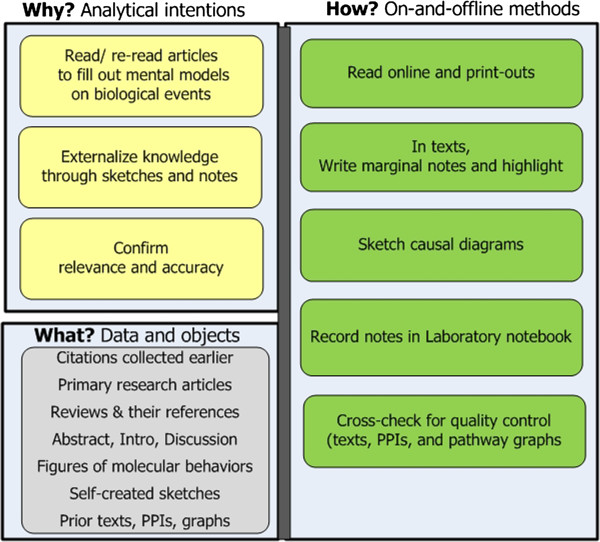
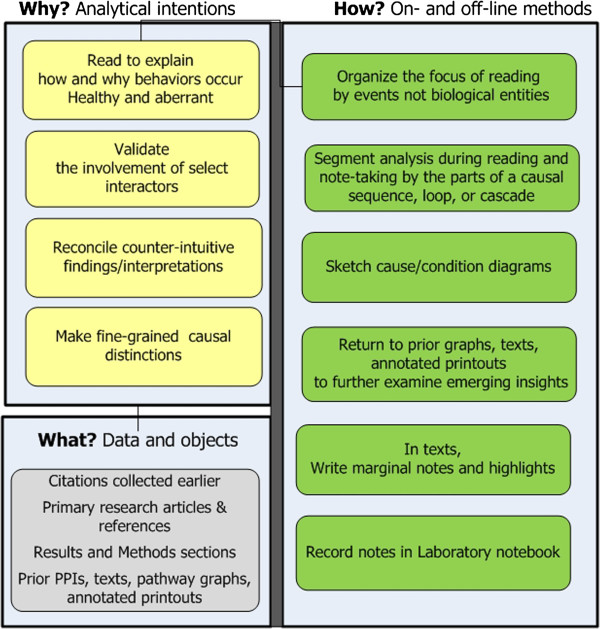
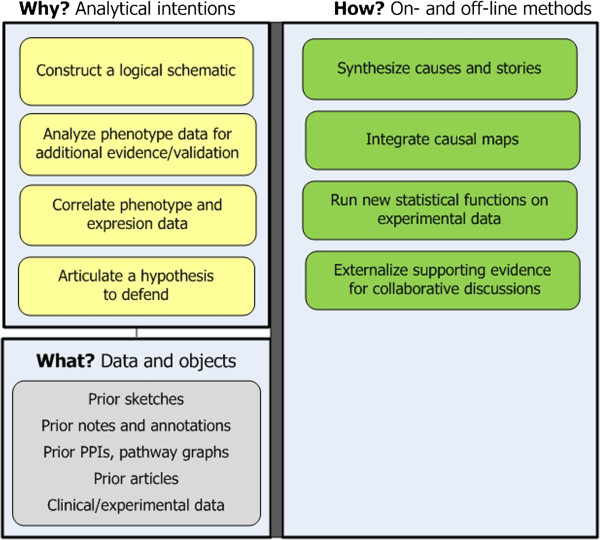
A common class of biomedical analysis is to explore expression data from high throughput experiments for the purpose of uncovering functional relationships that can lead to a hypothesis about mechanisms of a disease. We call this analysis expression driven, -omics hypothesizing. In it, scientists use interactive data visualizations and read deeply in the research literature. Little is known, however, about the actual flow of reasoning and behaviors (sense making) that scientists enact in this analysis, end-to-end. Understanding this flow is important because if bioinformatics tools are to be truly useful they must support it. Sense making models of visual analytics in other domains have been developed and used to inform the design of useful and usable tools. We believe they would be helpful in bioinformatics. To characterize the sense making involved in expression-driven, -omics hypothesizing, we conducted an in-depth observational study of one scientist as she engaged in this analysis over six months. From findings, we abstracted a preliminary sense making model. Here we describe its stages and suggest guidelines for developing visualization tools that we derived from this case. A single case cannot be generalized. But we offer our findings, sense making model and case-based tool guidelines as a first step toward increasing interest and further research in the bioinformatics field on scientists' analytical workflows and their implications for tool design.

摘要

一类常见的生物医学分析是探索高通量实验中的表达数据,目的是揭示功能关系,从而提出关于疾病机制的假设。我们将这种分析称为表达驱动的组学假设。在这种分析中,科学家们使用交互式数据可视化工具,并深入阅读研究文献。然而,对于科学家在整个分析过程中实际进行的推理和行为(意义建构),我们知之甚少。了解这一流程非常重要,因为如果生物信息学工具要真正有用,它们就必须支持这一流程。其他领域的可视化分析意义建构模型已经开发出来并用于为有用和可用的工具设计提供信息。我们相信它们在生物信息学中会很有帮助。为了描述表达驱动的组学假设中的意义建构,我们对一位科学家进行了为期六个月的深入观察研究,以观察她进行这种分析的情况。根据研究结果,我们抽象出一个初步的意义建构模型。在这里,我们描述了它的各个阶段,并根据这个案例提出了开发可视化工具的指导方针。单个案例不能推广。但是,我们提供我们的发现、意义建构模型和基于案例的工具指导方针,作为在生物信息学领域增加对科学家分析工作流程及其对工具设计影响的兴趣和进一步研究的第一步。

https://cdn.ncbi.nlm.nih.gov/pmc/blobs/554a/4021544/cab923c0b067/1471-2105-15-117-8.jpg
https://cdn.ncbi.nlm.nih.gov/pmc/blobs/554a/4021544/b75a61d46145/1471-2105-15-117-1.jpg
https://cdn.ncbi.nlm.nih.gov/pmc/blobs/554a/4021544/105516540354/1471-2105-15-117-2.jpg
https://cdn.ncbi.nlm.nih.gov/pmc/blobs/554a/4021544/36cd44acd750/1471-2105-15-117-3.jpg
https://cdn.ncbi.nlm.nih.gov/pmc/blobs/554a/4021544/ef79a0e5c02e/1471-2105-15-117-4.jpg
https://cdn.ncbi.nlm.nih.gov/pmc/blobs/554a/4021544/ec4f9fbbd622/1471-2105-15-117-5.jpg
https://cdn.ncbi.nlm.nih.gov/pmc/blobs/554a/4021544/a0a5099251b2/1471-2105-15-117-6.jpg
https://cdn.ncbi.nlm.nih.gov/pmc/blobs/554a/4021544/965164c90657/1471-2105-15-117-7.jpg
https://cdn.ncbi.nlm.nih.gov/pmc/blobs/554a/4021544/cab923c0b067/1471-2105-15-117-8.jpg

相似文献

1
Scientists' sense making when hypothesizing about disease mechanisms from expression data and their needs for visualization support.科学家从表达数据中假设疾病机制时的意义建构及其对可视化支持的需求。
BMC Bioinformatics. 2014 Apr 26;15:117. doi: 10.1186/1471-2105-15-117.
2
Supporting cognition in systems biology analysis: findings on users' processes and design implications.系统生物学分析中的认知支持:关于用户过程的发现及设计启示
J Biomed Discov Collab. 2009 Feb 13;4:2. doi: 10.1186/1747-5333-4-2.
3
A cognitive task analysis of a visual analytic workflow: Exploring molecular interaction networks in systems biology.视觉分析工作流程的认知任务分析:探索系统生物学中的分子相互作用网络。
J Biomed Discov Collab. 2011 Mar 21;6:1-33. doi: 10.5210/disco.v6i0.3410.
4
Familiarity Vs Trust: A Comparative Study of Domain Scientists' Trust in Visual Analytics and Conventional Analysis Methods.熟悉度与信任:领域科学家对可视化分析和传统分析方法的信任的比较研究。
IEEE Trans Vis Comput Graph. 2017 Jan;23(1):271-280. doi: 10.1109/TVCG.2016.2598544. Epub 2016 Aug 8.
5
Using Interactive Data Visualizations for Exploratory Analysis in Undergraduate Genomics Coursework: Field Study Findings and Guidelines.在本科基因组学课程作业中使用交互式数据可视化进行探索性分析:实地研究结果与指南
J Sci Educ Technol. 2016 Feb;25(1):91-110. doi: 10.1007/s10956-015-9579-z. Epub 2015 Sep 4.
6
Omics Playground: a comprehensive self-service platform for visualization, analytics and exploration of Big Omics Data.组学游乐场:一个用于可视化、分析和探索大型组学数据的综合自助服务平台。
NAR Genom Bioinform. 2019 Dec 6;2(1):lqz019. doi: 10.1093/nargab/lqz019. eCollection 2020 Mar.
7
Methods for visual mining of genomic and proteomic data atlases.基因组和蛋白质组数据图谱的可视化挖掘方法。
BMC Bioinformatics. 2012 Apr 23;13:58. doi: 10.1186/1471-2105-13-58.
8
Making sense of scientists' responsibilities at the interface of science and society. Commentary on "Six Domains of Research Ethics".理解科学家在科学与社会交叉领域的责任。对《研究伦理的六个领域》的评论
Sci Eng Ethics. 2002 Apr;8(2):223-7. doi: 10.1007/s11948-002-0023-4.
9
PeckVis: A Visual Analytics Tool to Analyze Dominance Hierarchies in Small Groups.PeckVis:一种用于分析小群体中优势等级的可视分析工具。
IEEE Trans Vis Comput Graph. 2020 Apr;26(4):1650-1660. doi: 10.1109/TVCG.2020.2969056. Epub 2020 Feb 5.
10
Studying PubMed usages in the field for complex problem solving: Implications for tool design.研究PubMed在复杂问题解决领域的应用:对工具设计的启示。
J Am Soc Inf Sci Technol. 2013 May 1;64(5):874-92. doi: 10.1002/asi.22796.

引用本文的文献

1
Research Infrastructure for Collaborative Team Science: Challenges in Technology-Supported Workflows in and Across Laboratories, Institutions, and Geographies.协作团队科学的研究基础设施:实验室内部、机构之间以及不同地域的技术支持工作流程面临的挑战
Semin Nephrol. 2015 May;35(3):291-302. doi: 10.1016/j.semnephrol.2015.04.009.
2
Visual analysis of biological data-knowledge networks.生物数据-知识网络的可视化分析
BMC Bioinformatics. 2015 Apr 29;16:135. doi: 10.1186/s12859-015-0550-z.

本文引用的文献

1
Variant view: visualizing sequence variants in their gene context.变体视图:在基因背景下可视化序列变体。
IEEE Trans Vis Comput Graph. 2013 Dec;19(12):2546-55. doi: 10.1109/TVCG.2013.214.
2
A multi-level typology of abstract visualization tasks.多层次抽象可视化任务类型学。
IEEE Trans Vis Comput Graph. 2013 Dec;19(12):2376-85. doi: 10.1109/TVCG.2013.124.
3
A cognitive task analysis of a visual analytic workflow: Exploring molecular interaction networks in systems biology.视觉分析工作流程的认知任务分析:探索系统生物学中的分子相互作用网络。
J Biomed Discov Collab. 2011 Mar 21;6:1-33. doi: 10.5210/disco.v6i0.3410.
4
Visualization of omics data for systems biology.系统生物学中组学数据的可视化。
Nat Methods. 2010 Mar;7(3 Suppl):S56-68. doi: 10.1038/nmeth.1436.
5
A nested model for visualization design and validation.嵌套模型用于可视化设计和验证。
IEEE Trans Vis Comput Graph. 2009 Nov-Dec;15(6):921-8. doi: 10.1109/TVCG.2009.111.
6
Supporting cognition in systems biology analysis: findings on users' processes and design implications.系统生物学分析中的认知支持:关于用户过程的发现及设计启示
J Biomed Discov Collab. 2009 Feb 13;4:2. doi: 10.1186/1747-5333-4-2.
7
Distributed cognition as a theoretical framework for information visualization.分布式认知:信息可视化的理论框架
IEEE Trans Vis Comput Graph. 2008 Nov-Dec;14(6):1173-80. doi: 10.1109/TVCG.2008.121.
8
Biochemistry. A postgenomic visual icon.生物化学。一个后基因组时代的视觉标志。
Science. 2008 Mar 28;319(5871):1772-3. doi: 10.1126/science.1151888.
9
Toward a deeper understanding of the role of interaction in information visualization.迈向对交互在信息可视化中作用的更深入理解。
IEEE Trans Vis Comput Graph. 2007 Nov-Dec;13(6):1224-31. doi: 10.1109/TVCG.2007.70515.
10
An insight-based longitudinal study of visual analytics.一项基于洞察的视觉分析纵向研究。
IEEE Trans Vis Comput Graph. 2006 Nov-Dec;12(6):1511-22. doi: 10.1109/TVCG.2006.85.