Liublinska Victoria, Rubin Donald B
Department of Statistics, Harvard University, Cambridge, MA 02138, U.S.A.
Stat Med. 2014 Oct 30;33(24):4170-85. doi: 10.1002/sim.6197. Epub 2014 May 20.
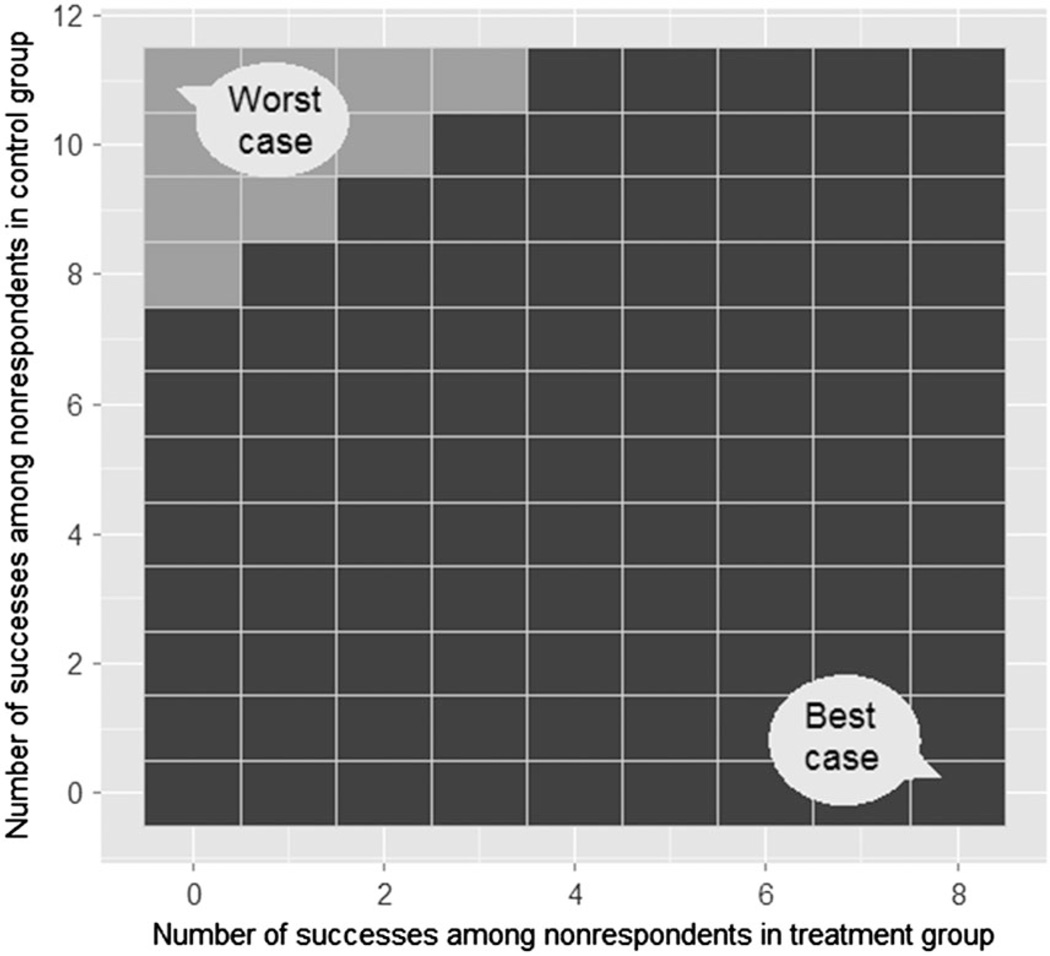
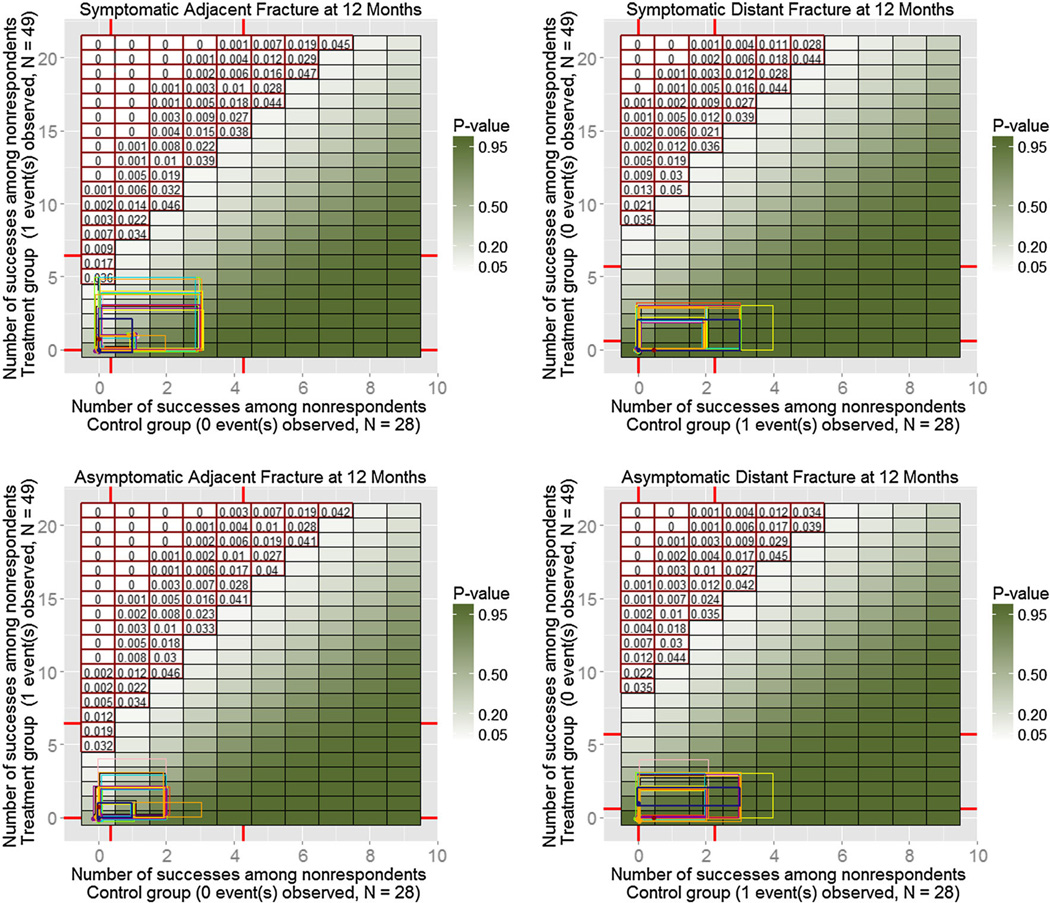
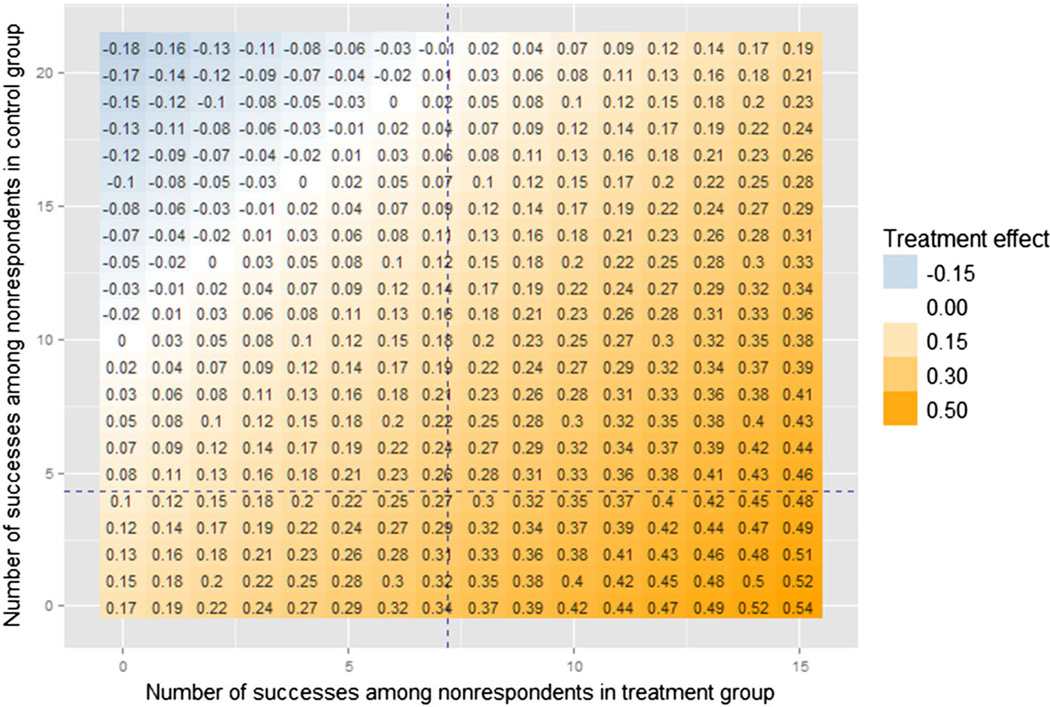
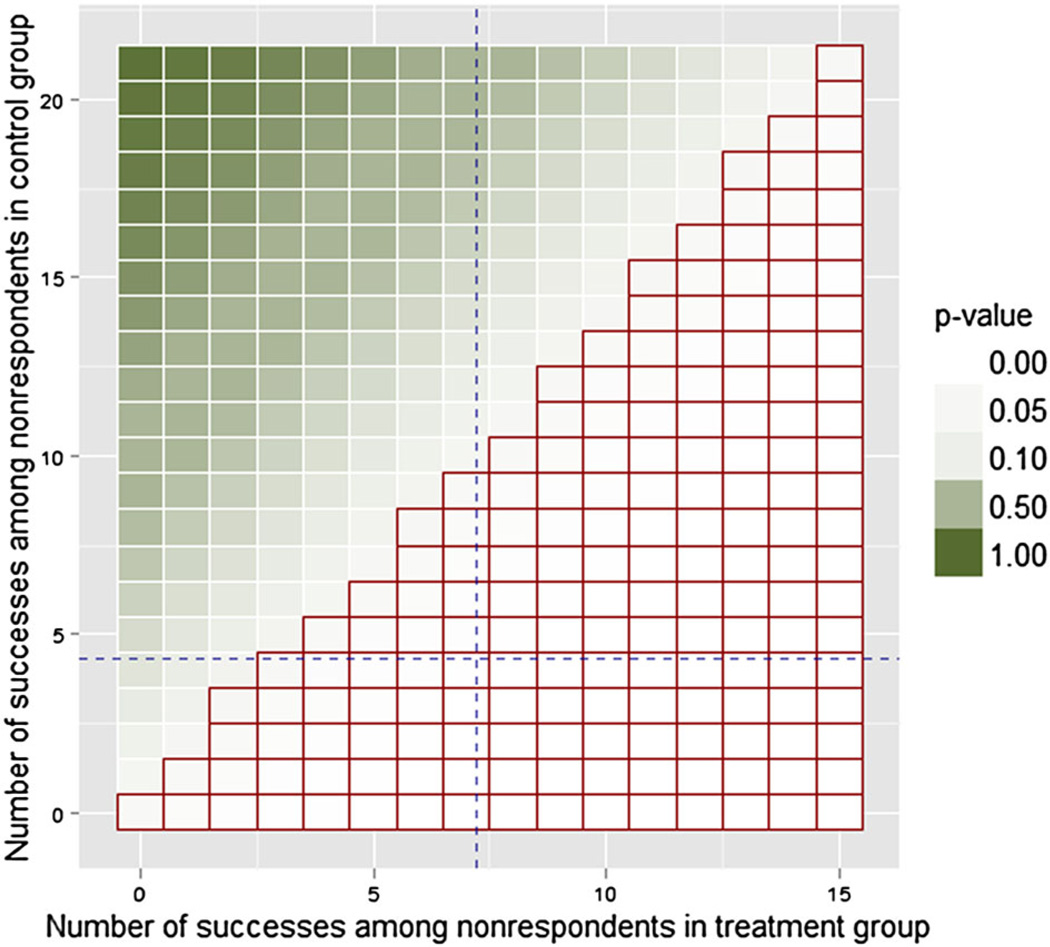
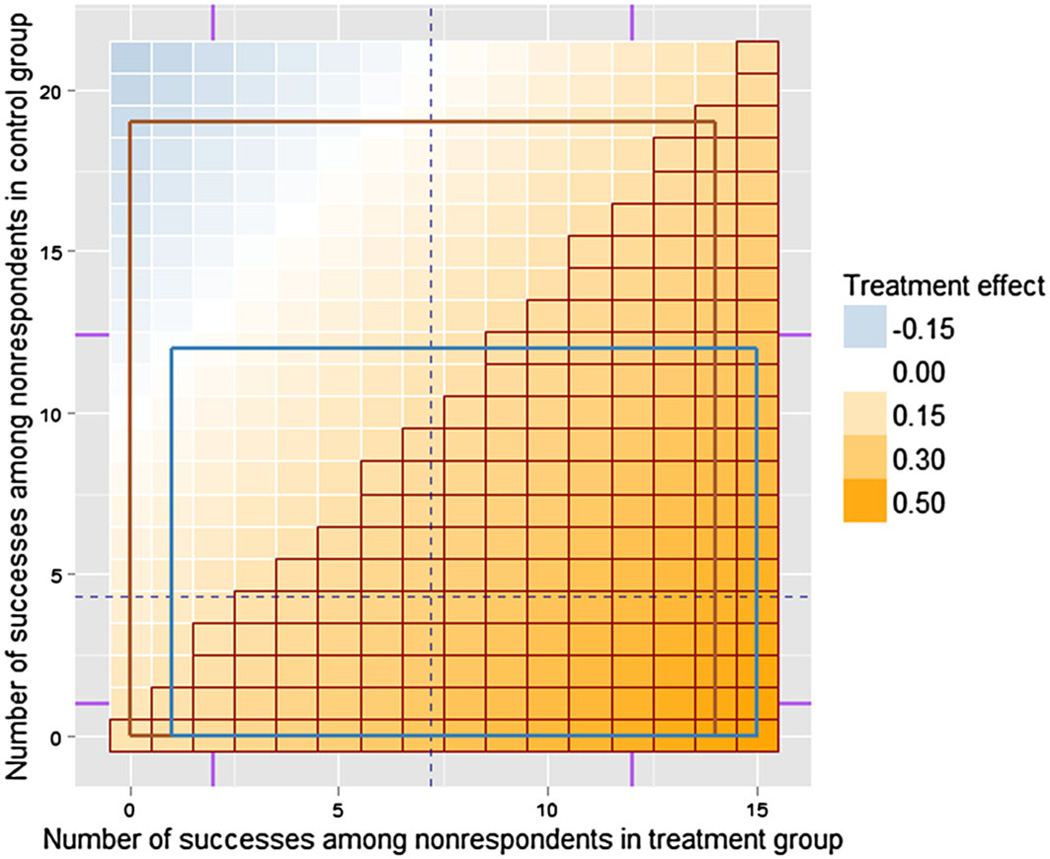
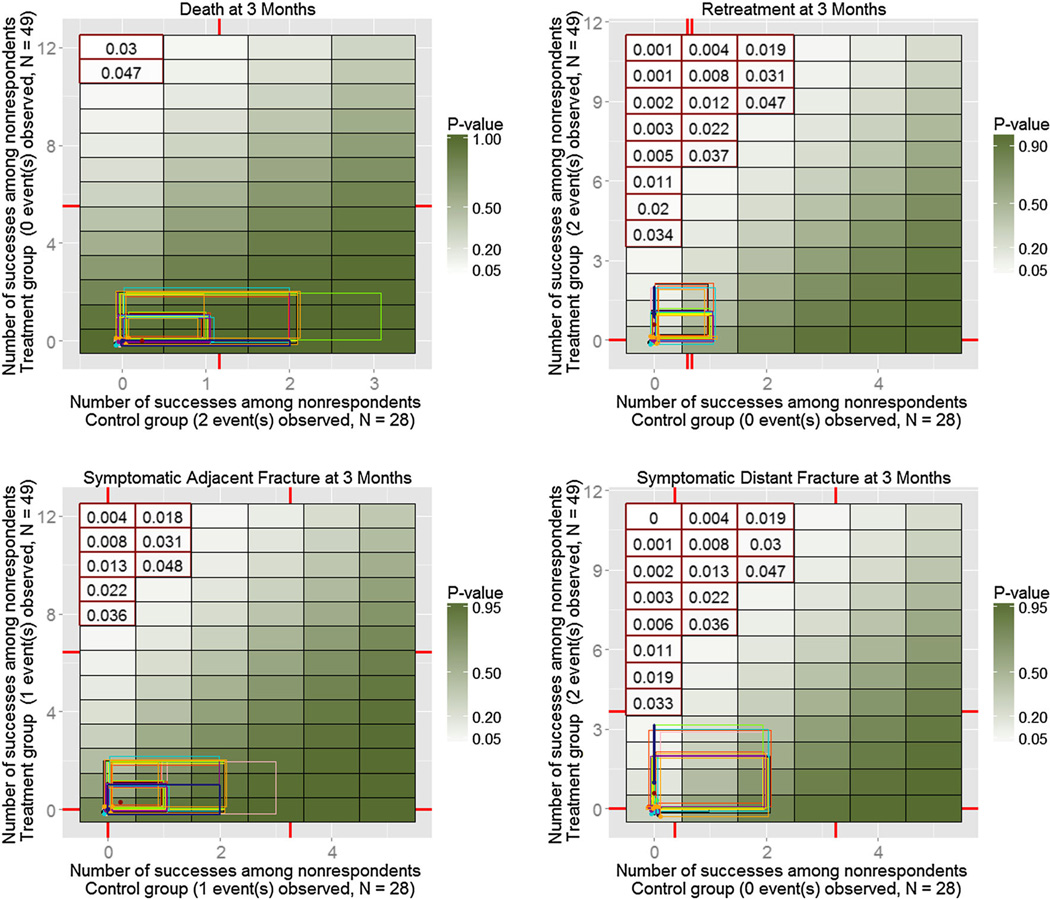
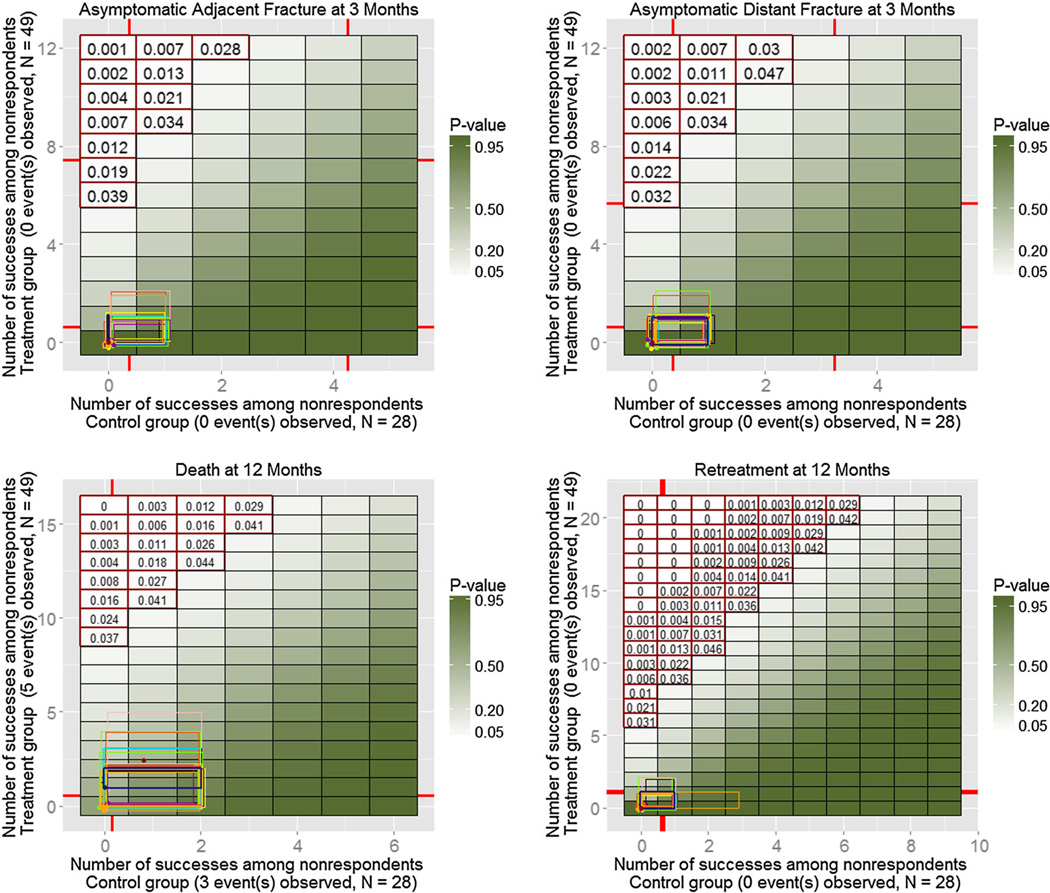
Although recent guidelines for dealing with missing data emphasize the need for sensitivity analyses, and such analyses have a long history in statistics, universal recommendations for conducting and displaying these analyses are scarce. We propose graphical displays that help formalize and visualize the results of sensitivity analyses, building upon the idea of 'tipping-point' analysis for randomized experiments with a binary outcome and a dichotomous treatment. The resulting 'enhanced tipping-point displays' are convenient summaries of conclusions obtained from making different modeling assumptions about missingness mechanisms. The primary goal of the displays is to make formal sensitivity analysesmore comprehensible to practitioners, thereby helping them assess the robustness of the experiment's conclusions to plausible missingness mechanisms. We also present a recent example of these enhanced displays in amedical device clinical trial that helped lead to FDA approval.
尽管最近关于处理缺失数据的指南强调了敏感性分析的必要性,且此类分析在统计学中有着悠久的历史,但关于进行和展示这些分析的通用建议却很少。我们基于二元结果和二分治疗的随机试验的“临界点”分析理念,提出了有助于形式化和可视化敏感性分析结果的图形展示方法。由此产生的“增强型临界点展示”是对因对缺失机制做出不同建模假设而得出的结论的便捷总结。这些展示的主要目的是使形式化的敏感性分析对从业者来说更易于理解,从而帮助他们评估实验结论对于合理的缺失机制的稳健性。我们还展示了这些增强型展示在一项医疗器械临床试验中的最新示例,该示例有助于获得美国食品药品监督管理局(FDA)的批准。