Jäger Günter, Peltzer Alexander, Nieselt Kay
Integrative Transcriptomics, Center for Bioinformatics, University of Tübingen, Sand 14, 72076 Tübingen, Germany.
BMC Bioinformatics. 2014 Jul 10;15:200. doi: 10.1186/1471-2105-15-200.
To understand individual genomes it is necessary to look at the variations that lead to changes in phenotype and possibly to disease. However, genotype information alone is often not sufficient and additional knowledge regarding the phase of the variation is needed to make correct interpretations. Interactive visualizations, that allow the user to explore the data in various ways, can be of great assistance in the process of making well informed decisions. But, currently there is a lack for visualizations that are able to deal with phased haplotype data.
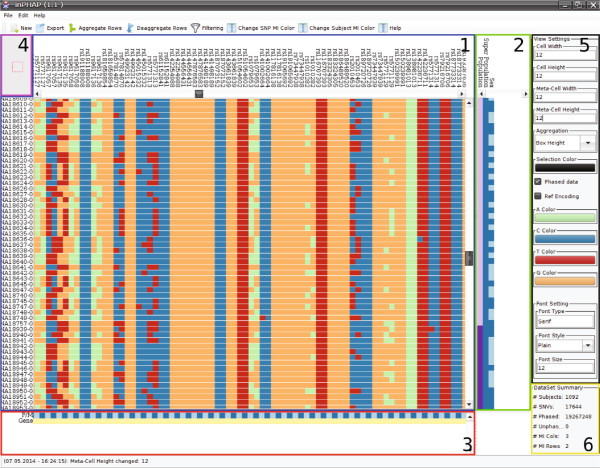
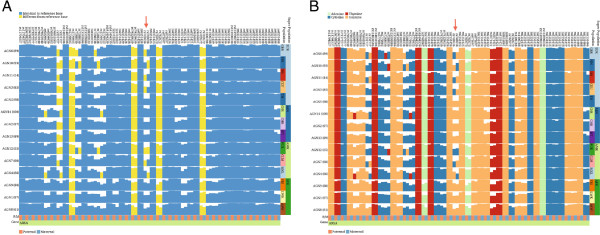
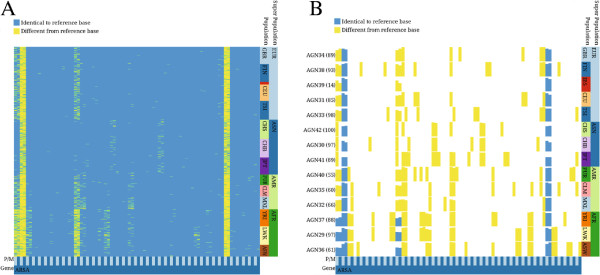
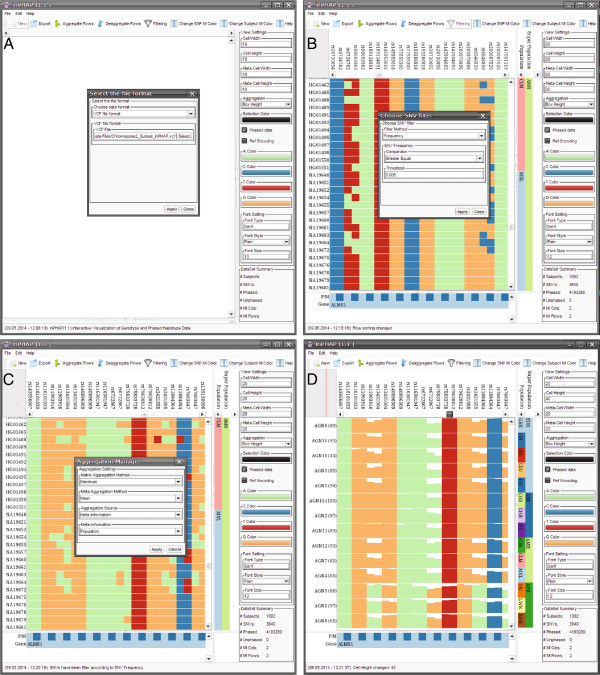
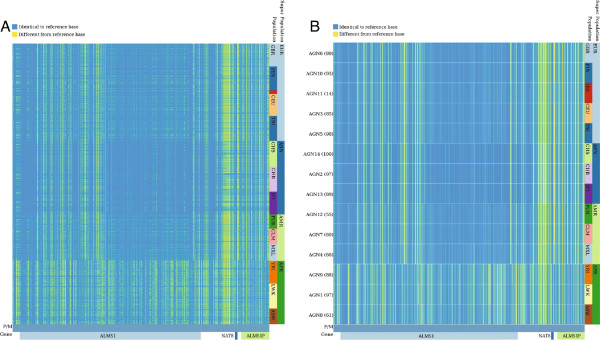
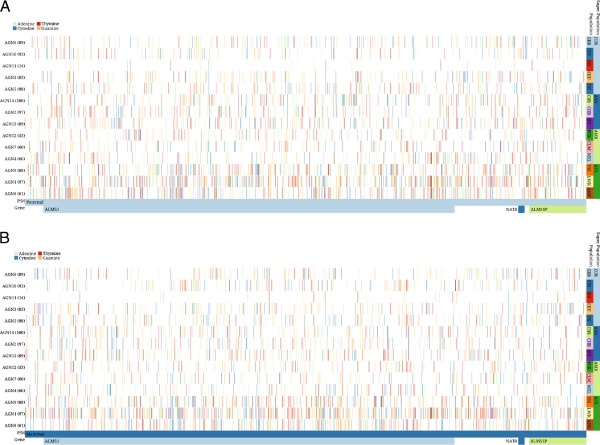
We present inPHAP, an interactive visualization tool for genotype and phased haplotype data. inPHAP features a variety of interaction possibilities such as zooming, sorting, filtering and aggregation of rows in order to explore patterns hidden in large genetic data sets. As a proof of concept, we apply inPHAP to the phased haplotype data set of Phase 1 of the 1000 Genomes Project. Thereby, inPHAP's ability to show genetic variations on the population as well as on the individuals level is demonstrated for several disease related loci.
As of today, inPHAP is the only visual analytical tool that allows the user to explore unphased and phased haplotype data interactively. Due to its highly scalable design, inPHAP can be applied to large datasets with up to 100 GB of data, enabling users to visualize even large scale input data. inPHAP closes the gap between common visualization tools for unphased genotype data and introduces several new features, such as the visualization of phased data. inPHAP is available for download at http://bit.ly/1iJgKmX.
为了解个体基因组,有必要研究导致表型变化甚至可能引发疾病的变异。然而,仅靠基因型信息往往并不足够,还需要有关变异相位的额外知识才能做出正确解读。交互式可视化工具能让用户以各种方式探索数据,在做出明智决策的过程中能提供很大帮助。但是,目前缺乏能够处理相位单倍型数据的可视化工具。
我们展示了inPHAP,这是一款用于基因型和相位单倍型数据的交互式可视化工具。inPHAP具有多种交互功能,如缩放、排序、过滤和行聚合,以便探索隐藏在大型遗传数据集中的模式。作为概念验证,我们将inPHAP应用于千人基因组计划第一阶段的相位单倍型数据集。由此,inPHAP在群体以及个体层面展示遗传变异的能力在几个与疾病相关的基因座上得到了证明。
截至目前,inPHAP是唯一一款允许用户交互式探索未分型和分型单倍型数据的可视化分析工具。由于其高度可扩展的设计,inPHAP可应用于数据量高达100GB的大型数据集,使用户能够可视化甚至大规模的输入数据。inPHAP填补了用于未分型基因型数据的常见可视化工具之间的空白,并引入了几个新功能,如分型数据的可视化。可在http://bit.ly/1iJgKmX下载inPHAP。