ORISE Fellow, USDA-ARS Corn Insects and Crop Genetics Research Unit, Ames, IA, 50011, USA.
USDA-ARS Corn Insects and Crop Genetics Research Unit, Ames, IA, 50011, USA.
BMC Genomics. 2020 Nov 23;21(1):822. doi: 10.1186/s12864-020-07217-2.
Large genotyping datasets have become commonplace due to efficient, cheap methods for SNP identification. Typical genotyping datasets may have thousands to millions of data points per accession, across tens to thousands of accessions. There is a need for tools to help rapidly explore such datasets, to assess characteristics such as overall differences between accessions and regional anomalies across the genome.
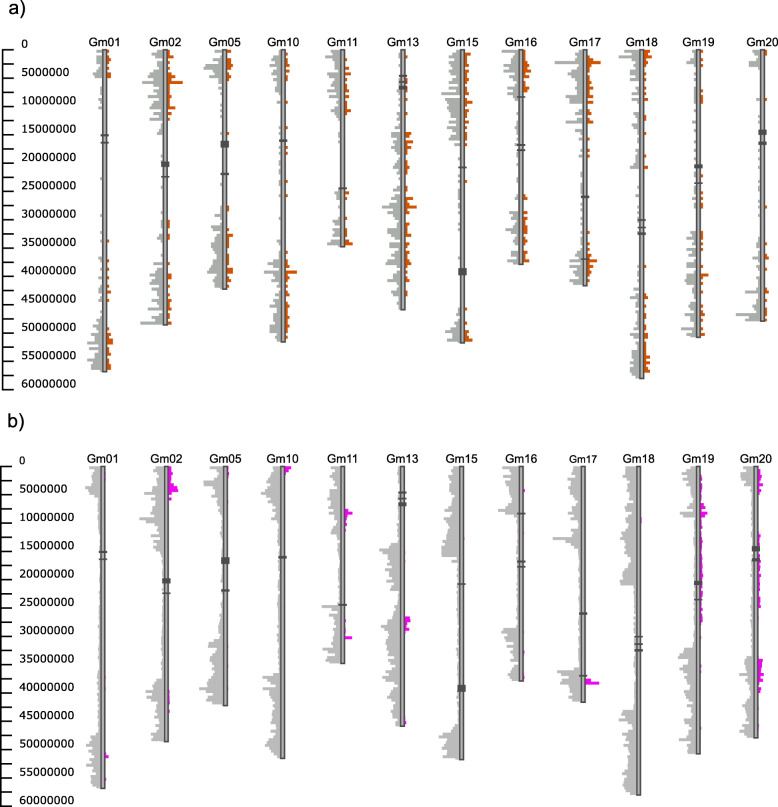
We present GCViT (Genotype Comparison Visualization Tool), for visualizing and exploring large genotyping datasets. GCViT can be used to identify introgressions, conserved or divergent genomic regions, pedigrees, and other features for more detailed exploration. The program can be used online or as a local instance for whole genome visualization of resequencing or SNP array data. The program performs comparisons of variants among user-selected accessions to identify allele differences and similarities between accessions and a user-selected reference, providing visualizations through histogram, heatmap, or haplotype views. The resulting analyses and images can be exported in various formats.
GCViT provides methods for interactively visualizing SNP data on a whole genome scale, and can produce publication-ready figures. It can be used in online or local installations. GCViT enables users to confirm or identify genomics regions of interest associated with particular traits. GCViT is freely available at https://github.com/LegumeFederation/gcvit . The 1.0 version described here is available at https://doi.org/10.5281/zenodo.4008713 .
由于 SNP 鉴定的高效、廉价方法,大型基因分型数据集已经变得很常见。典型的基因分型数据集可能每个样本有数千到数百万个数据点,涉及数千到数万样本。因此需要工具来帮助快速探索这些数据集,评估样本之间的整体差异和基因组区域的异常等特征。
我们提出了 GCViT(基因型比较可视化工具),用于可视化和探索大型基因分型数据集。GCViT 可用于识别渐渗、保守或分歧的基因组区域、系谱和其他特征,以进行更详细的探索。该程序可在线使用或作为本地实例,用于重测序或 SNP 芯片数据的全基因组可视化。该程序对用户选择的样本中的变体进行比较,以识别样本之间的等位基因差异和相似性,以及与用户选择的参考样本之间的差异和相似性,并通过直方图、热图或单倍型视图提供可视化。生成的分析和图像可以以各种格式导出。
GCViT 提供了在全基因组范围内交互可视化 SNP 数据的方法,并可以生成可发表的图形。它可以在线或本地安装使用。GCViT 允许用户确认或识别与特定特征相关的感兴趣的基因组区域。GCViT 可在 https://github.com/LegumeFederation/gcvit 上免费获取。这里描述的 1.0 版本可在 https://doi.org/10.5281/zenodo.4008713 上获取。