• 文献检索
  • 文档翻译
  • 深度研究
  • 学术资讯
  • Suppr Zotero 插件Zotero 插件
  • 邀请有礼
  • 套餐&价格
  • 历史记录
应用&插件
Suppr Zotero 插件Zotero 插件浏览器插件Mac 客户端Windows 客户端微信小程序
定价
高级版会员购买积分包购买API积分包
服务
文献检索文档翻译深度研究API 文档MCP 服务
关于我们
关于 Suppr公司介绍联系我们用户协议隐私条款
关注我们

Suppr 超能文献

核心技术专利:CN118964589B侵权必究
粤ICP备2023148730 号-1Suppr @ 2026

文献检索

告别复杂PubMed语法,用中文像聊天一样搜索,搜遍4000万医学文献。AI智能推荐,让科研检索更轻松。

立即免费搜索

文件翻译

保留排版,准确专业,支持PDF/Word/PPT等文件格式,支持 12+语言互译。

免费翻译文档

深度研究

AI帮你快速写综述,25分钟生成高质量综述,智能提取关键信息,辅助科研写作。

立即免费体验

Shiny-phyloseq:用于具有溯源追踪功能的交互式微生物组分析的网络应用程序。

Shiny-phyloseq: Web application for interactive microbiome analysis with provenance tracking.

作者信息

McMurdie Paul J, Holmes Susan

机构信息

Department of Statistics, Stanford University, Stanford, CA 94305, USA.

出版信息

Bioinformatics. 2015 Jan 15;31(2):282-3. doi: 10.1093/bioinformatics/btu616. Epub 2014 Sep 26.

DOI:10.1093/bioinformatics/btu616
PMID:25262154
原文链接:https://pmc.ncbi.nlm.nih.gov/articles/PMC4287943/
Abstract

UNLABELLED

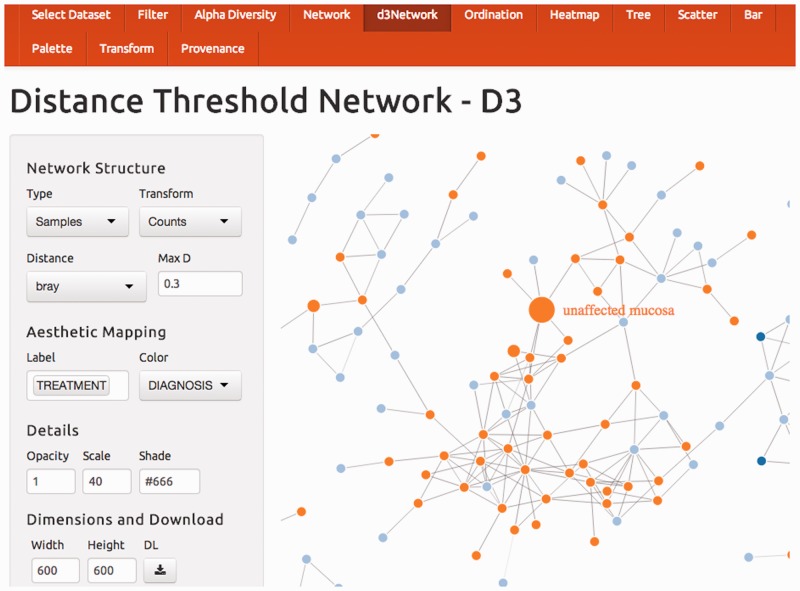
We have created a Shiny-based Web application, called Shiny-phyloseq, for dynamic interaction with microbiome data that runs on any modern Web browser and requires no programming, increasing the accessibility and decreasing the entrance requirement to using phyloseq and related R tools. Along with a data- and context-aware dynamic interface for exploring the effects of parameter and method choices, Shiny-phyloseq also records the complete user input and subsequent graphical results of a user's session, allowing the user to archive, share and reproduce the sequence of steps that created their result-without writing any new code themselves.

AVAILABILITY AND IMPLEMENTATION

Shiny-phyloseq is implemented entirely in the R language. It can be hosted/launched by any system with R installed, including Windows, Mac OS and most Linux distributions. Information technology administrators can also host Shiny--phyloseq from a remote server, in which case users need only have a Web browser installed. Shiny-phyloseq is provided free of charge under a GPL-3 open-source license through GitHub at http://joey711.github.io/shiny-phyloseq/.

摘要

未标注

我们创建了一个基于Shiny的Web应用程序,名为Shiny-phyloseq,用于与微生物组数据进行动态交互,它可在任何现代Web浏览器上运行,无需编程,提高了可访问性并降低了使用phyloseq及相关R工具的入门要求。除了一个用于探索参数和方法选择效果的数据感知和上下文感知动态界面外,Shiny-phyloseq还记录用户会话的完整输入和后续图形结果,允许用户存档、共享和重现创建其结果的步骤序列,而无需用户自己编写任何新代码。

可用性和实现方式

Shiny-phyloseq完全用R语言实现。它可以由任何安装了R的系统托管/启动,包括Windows、Mac OS和大多数Linux发行版。信息技术管理员也可以从远程服务器托管Shiny-phyloseq,在这种情况下,用户只需安装一个Web浏览器。Shiny-phyloseq在GPL-3开源许可下通过GitHub免费提供,网址为http://joey711.github.io/shiny-phyloseq/ 。

https://cdn.ncbi.nlm.nih.gov/pmc/blobs/3c08/4287943/6da14e1f9f36/btu616f1p.jpg

相似文献

1
Shiny-phyloseq: Web application for interactive microbiome analysis with provenance tracking.Shiny-phyloseq:用于具有溯源追踪功能的交互式微生物组分析的网络应用程序。
Bioinformatics. 2015 Jan 15;31(2):282-3. doi: 10.1093/bioinformatics/btu616. Epub 2014 Sep 26.
2
phylogeo: an R package for geographic analysis and visualization of microbiome data.phylogeo:一个用于微生物组数据地理分析和可视化的R软件包。
Bioinformatics. 2015 Sep 1;31(17):2909-11. doi: 10.1093/bioinformatics/btv269. Epub 2015 Apr 25.
3
phyloseq: an R package for reproducible interactive analysis and graphics of microbiome census data.phyloseq:一个用于重现交互式分析和微生物组普查数据分析的图形的 R 包。
PLoS One. 2013 Apr 22;8(4):e61217. doi: 10.1371/journal.pone.0061217. Print 2013.
4
StructuRly: A novel shiny app to produce comprehensive, detailed and interactive plots for population genetic analysis.StructuRly:一个新颖的 shiny 应用程序,用于生成全面、详细和交互式的群体遗传分析图。
PLoS One. 2020 Feb 19;15(2):e0229330. doi: 10.1371/journal.pone.0229330. eCollection 2020.
5
SynRio: R and Shiny based application platform for cyanobacterial genome analysis.SynRio:基于R和Shiny的蓝藻基因组分析应用平台。
Bioinformation. 2015 Sep 30;11(9):422-5. doi: 10.6026/97320630011422. eCollection 2015.
6
Dynamic assessment of microbial ecology (DAME): a web app for interactive analysis and visualization of microbial sequencing data.动态评估微生物生态学 (DAME):一个用于交互式分析和可视化微生物测序数据的网络应用程序。
Bioinformatics. 2018 Mar 15;34(6):1050-1052. doi: 10.1093/bioinformatics/btx686.
7
ShinyGPAS: interactive genomic prediction accuracy simulator based on deterministic formulas.ShinyGPAS:基于确定性公式的交互式基因组预测准确性模拟器。
Genet Sel Evol. 2017 Dec 20;49(1):91. doi: 10.1186/s12711-017-0368-4.
8
TCC-GUI: a Shiny-based application for differential expression analysis of RNA-Seq count data.TCC-GUI:一个基于Shiny的用于RNA测序计数数据差异表达分析的应用程序。
BMC Res Notes. 2019 Mar 13;12(1):133. doi: 10.1186/s13104-019-4179-2.
9
GOplot: an R package for visually combining expression data with functional analysis.GOplot:一个用于将表达数据与功能分析进行可视化整合的R软件包。
Bioinformatics. 2015 Sep 1;31(17):2912-4. doi: 10.1093/bioinformatics/btv300. Epub 2015 May 11.
10
MEPHAS: an interactive graphical user interface for medical and pharmaceutical statistical analysis with R and Shiny.MEPHAS:一个用于 R 和 Shiny 的医学和药物统计分析的交互式图形用户界面。
BMC Bioinformatics. 2020 May 11;21(1):183. doi: 10.1186/s12859-020-3494-x.

引用本文的文献

1
Influence of Seasonality and Pollution on the Presence of Antibiotic Resistance Genes and Potentially Pathogenic Bacteria in a Tropical Urban River.季节性和污染对热带城市河流中抗生素抗性基因和潜在致病细菌存在情况的影响
Antibiotics (Basel). 2025 Aug 5;14(8):798. doi: 10.3390/antibiotics14080798.
2
Soil microbial diversity: A key factor in pathogen suppression and inoculant performance.土壤微生物多样性:病原菌抑制和接种剂性能的关键因素。
Geoderma. 2025 Aug;460:117444. doi: 10.1016/j.geoderma.2025.117444.
3
Chinese soy-based microbiome and associated microbial risks: a metagenomic investigation.

本文引用的文献

1
Waste not, want not: why rarefying microbiome data is inadmissible.不浪费,不匮乏:为何微生物组数据稀疏化不可取。
PLoS Comput Biol. 2014 Apr 3;10(4):e1003531. doi: 10.1371/journal.pcbi.1003531. eCollection 2014 Apr.
2
phyloseq: an R package for reproducible interactive analysis and graphics of microbiome census data.phyloseq:一个用于重现交互式分析和微生物组普查数据分析的图形的 R 包。
PLoS One. 2013 Apr 22;8(4):e61217. doi: 10.1371/journal.pone.0061217. Print 2013.
3
The Biological Observation Matrix (BIOM) format or: how I learned to stop worrying and love the ome-ome.
基于大豆的中国微生物组及其相关微生物风险:一项宏基因组学研究。
NPJ Biofilms Microbiomes. 2025 Jul 18;11(1):136. doi: 10.1038/s41522-025-00768-w.
4
iSEEtree: interactive explorer for hierarchical data.iSEEtree:分层数据交互式浏览器。
Bioinform Adv. 2025 May 6;5(1):vbaf107. doi: 10.1093/bioadv/vbaf107. eCollection 2025.
5
Impact of seasonal flooding and hydrological connectivity loss on microbial community dynamics in mangrove sediments of the southern Gulf of Mexico.季节性洪水和水文连通性丧失对墨西哥湾南部红树林沉积物中微生物群落动态的影响。
PeerJ. 2025 May 5;13:e19371. doi: 10.7717/peerj.19371. eCollection 2025.
6
Neonatal gut microbiota succession in mice mapped over time, site, injury and single immunoglobulin interleukin-1 related receptor genotype.小鼠新生儿肠道微生物群随时间、部位、损伤和单免疫球蛋白白细胞介素-1相关受体基因型的演替情况。
iScience. 2025 Mar 18;28(4):112243. doi: 10.1016/j.isci.2025.112243. eCollection 2025 Apr 18.
7
Using short-read 16S rRNA sequencing of multiple variable regions to generate high-quality results to a species level.使用多个可变区的短读长16S rRNA测序,以在物种水平上生成高质量结果。
Front Bioinform. 2025 Mar 17;5:1484113. doi: 10.3389/fbinf.2025.1484113. eCollection 2025.
8
Comparative metagenomic analysis of the oral microbiome in COVID-19 patients and healthy individuals.COVID-19患者与健康个体口腔微生物群的比较宏基因组分析。
Sci Rep. 2025 Mar 25;15(1):10303. doi: 10.1038/s41598-024-81864-3.
9
Multi-omics analysis of the correlation between surface microbiome and metabolome in Saccharina latissima (Laminariales, Phaeophyceae).海带(海带目,褐藻纲)表面微生物组与代谢组之间相关性的多组学分析。
FEMS Microbiol Ecol. 2025 Feb 20;101(3). doi: 10.1093/femsec/fiae160.
10
Determining the incidence, risk factors and biological drivers of irritable bowel syndrome (IBS) as part of the constellation of postacute sequelae of SARS-CoV-2 infection (PASC) outcomes in the Arizona CoVHORT-GI: a longitudinal cohort study.在亚利桑那州新冠病毒感染后胃肠道后遗症(PASC)结局研究队列(Arizona CoVHORT-GI)中,确定肠易激综合征(IBS)作为严重急性呼吸综合征冠状病毒2(SARS-CoV-2)感染后急性后遗症(PASC)综合征一部分的发病率、风险因素和生物学驱动因素:一项纵向队列研究。
BMJ Open. 2025 Jan 30;15(1):e095093. doi: 10.1136/bmjopen-2024-095093.
生物观测矩阵(BIOM)格式或:我如何学会不再担心并爱上 ome-ome。
Gigascience. 2012 Jul 12;1(1):7. doi: 10.1186/2047-217X-1-7.
4
Reproducible research in computational science.计算科学中的可重复性研究。
Science. 2011 Dec 2;334(6060):1226-7. doi: 10.1126/science.1213847.
5
D³: Data-Driven Documents.D³:数据驱动文档。
IEEE Trans Vis Comput Graph. 2011 Dec;17(12):2301-9. doi: 10.1109/TVCG.2011.185.
6
CloVR: a virtual machine for automated and portable sequence analysis from the desktop using cloud computing.CloVR:一种虚拟机,用于在桌面环境下通过云计算实现自动化和可移植的序列分析。
BMC Bioinformatics. 2011 Aug 30;12:356. doi: 10.1186/1471-2105-12-356.
7
Differential expression analysis for sequence count data.差异表达分析序列计数数据。
Genome Biol. 2010;11(10):R106. doi: 10.1186/gb-2010-11-10-r106. Epub 2010 Oct 27.
8
QIIME allows analysis of high-throughput community sequencing data.QIIME可用于分析高通量群落测序数据。
Nat Methods. 2010 May;7(5):335-6. doi: 10.1038/nmeth.f.303. Epub 2010 Apr 11.
9
Fast UniFrac: facilitating high-throughput phylogenetic analyses of microbial communities including analysis of pyrosequencing and PhyloChip data.快速 UniFrac:促进高通量微生物群落的系统发育分析,包括对 pyrosequencing 和 PhyloChip 数据的分析。
ISME J. 2010 Jan;4(1):17-27. doi: 10.1038/ismej.2009.97. Epub 2009 Aug 27.
10
The metagenomics RAST server - a public resource for the automatic phylogenetic and functional analysis of metagenomes.宏基因组学RAST服务器——用于宏基因组自动系统发育和功能分析的公共资源。
BMC Bioinformatics. 2008 Sep 19;9:386. doi: 10.1186/1471-2105-9-386.