Nuti Sudhakar V, Wang Yongfei, Masoudi Frederick A, Bratzler Dale W, Bernheim Susannah M, Murugiah Karthik, Krumholz Harlan M
*Center for Outcomes Research and Evaluation, Yale-New Haven Hospital, New Haven, CT †Division of Cardiology, University of Colorado Anschutz Medical Campus, Aurora, CO ‡University of Oklahoma Health Sciences Center, Oklahoma City, OK §Section of Cardiovascular Medicine and the Robert Wood Johnson Foundation Clinical Scholars Program, Department of Internal Medicine, Yale University School of Medicine ∥Department of Health Policy and Management, Yale School of Public Health, New Haven, CT.
Med Care. 2015 Jun;53(6):485-91. doi: 10.1097/MLR.0000000000000358.
Medicare hospital core process measures have improved over time, but little is known about how the distribution of performance across hospitals has changed, particularly among the lowest performing hospitals.
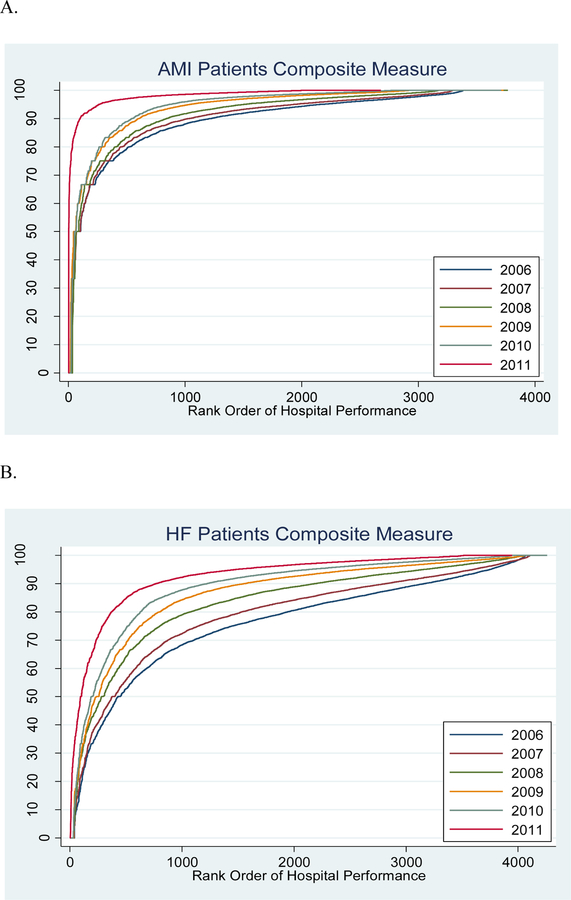
We studied all US hospitals reporting performance measure data on process measures for acute myocardial infarction (AMI), heart failure (HF), and pneumonia (PN) to the Centers for Medicare & Medicaid Services from 2006 to 2011. We assessed changes in performance across hospital ranks, variability in the distribution of performance rates, and linear trends in the 10th percentile (lowest) of performance over time for both individual measures and a created composite measure for each condition.
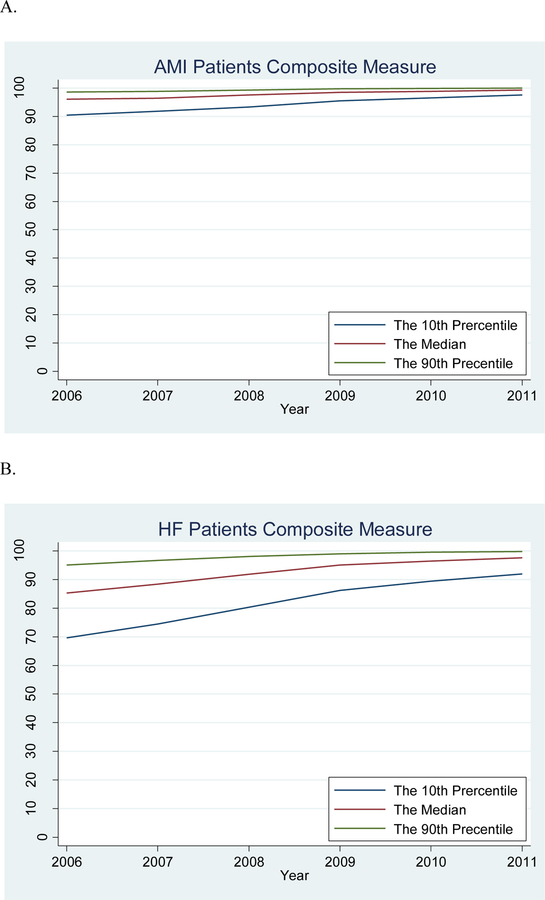
More than 4000 hospitals submitted measure data each year. There were marked improvements in hospital performance measures (median performance for composite measures: AMI: 96%-99%, HF: 85%-98%, PN: 83%-97%). A greater number of hospitals reached the 100% performance level over time for all individual and composite measures. For the composite measures, the 10th percentile significantly improved (AMI: 90%-98%, P<0.0001 for trend; HF: 70%-92%, P=0.0002; PN: 71%-92%, P=0.0003); the variation (90th percentile rate minus 10th percentile rate) decreased from 9% in 2006 to 2% in 2011 for AMI, 25%-8% for HF, and 20%-7% for PN.
From 2006 to 2011, not only did the median performance improve but the distribution of performance narrowed. Focus needs to shift away from processes measures to new measures of quality.
随着时间推移,医疗保险医院核心流程指标有所改善,但对于各医院绩效分布的变化情况,尤其是绩效最差的医院,我们了解甚少。
我们研究了2006年至2011年期间向医疗保险和医疗补助服务中心报告急性心肌梗死(AMI)、心力衰竭(HF)和肺炎(PN)流程指标绩效数据的所有美国医院。我们评估了不同医院排名的绩效变化、绩效率分布的变异性,以及各单项指标和每种疾病创建的综合指标在绩效第10百分位数(最低)随时间的线性趋势。
每年有超过4000家医院提交指标数据。医院绩效指标有显著改善(综合指标的中位数绩效:AMI:96%-99%,HF:85%-98%,PN:83%-97%)。随着时间推移,越来越多的医院在所有单项和综合指标上达到了100%的绩效水平。对于综合指标,第10百分位数显著提高(AMI:90%-98%,趋势P<0.0001;HF:70%-92%,P=0.0002;PN:71%-92%,P=0.0003);变异度(第90百分位数率减去第10百分位数率)在2006年至2011年期间,AMI从9%降至2%,HF从25%降至8%,PN从20%降至7%。
从2006年到2011年,不仅中位数绩效有所提高,而且绩效分布变窄。重点需要从流程指标转向新的质量指标。