• 文献检索
  • 文档翻译
  • 深度研究
  • 学术资讯
  • Suppr Zotero 插件Zotero 插件
  • 邀请有礼
  • 套餐&价格
  • 历史记录
应用&插件
Suppr Zotero 插件Zotero 插件浏览器插件Mac 客户端Windows 客户端微信小程序
定价
高级版会员购买积分包购买API积分包
服务
文献检索文档翻译深度研究API 文档MCP 服务
关于我们
关于 Suppr公司介绍联系我们用户协议隐私条款
关注我们

Suppr 超能文献

核心技术专利:CN118964589B侵权必究
粤ICP备2023148730 号-1Suppr @ 2026

文献检索

告别复杂PubMed语法,用中文像聊天一样搜索,搜遍4000万医学文献。AI智能推荐,让科研检索更轻松。

立即免费搜索

文件翻译

保留排版,准确专业,支持PDF/Word/PPT等文件格式,支持 12+语言互译。

免费翻译文档

深度研究

AI帮你快速写综述,25分钟生成高质量综述,智能提取关键信息,辅助科研写作。

立即免费体验

绘制特定病因的过早死亡率显示,2003年至2009年期间比利时各地区之间存在巨大差异。

Mapping the cause-specific premature mortality reveals large between-districts disparity in Belgium, 2003-2009.

作者信息

Renard Françoise, Tafforeau Jean, Deboosere Patrick

机构信息

Department Public Health and Surveillance, Institute of Public Health, Brussels, Belgium.

Interface Demography, Section Social Research, Free University of Brussels, Brussels, Belgium.

出版信息

Arch Public Health. 2015 Mar 23;73(1):13. doi: 10.1186/s13690-015-0060-5. eCollection 2015.

DOI:10.1186/s13690-015-0060-5
PMID:25922667
原文链接:https://pmc.ncbi.nlm.nih.gov/articles/PMC4412101/
Abstract

BACKGROUND

Reducing premature mortality is a crucial public health objective. The goal of this paper, beside updating previous mortality atlases with recent data, is to explore the relative between-districts disparity using a relative-scale map design.

METHODS

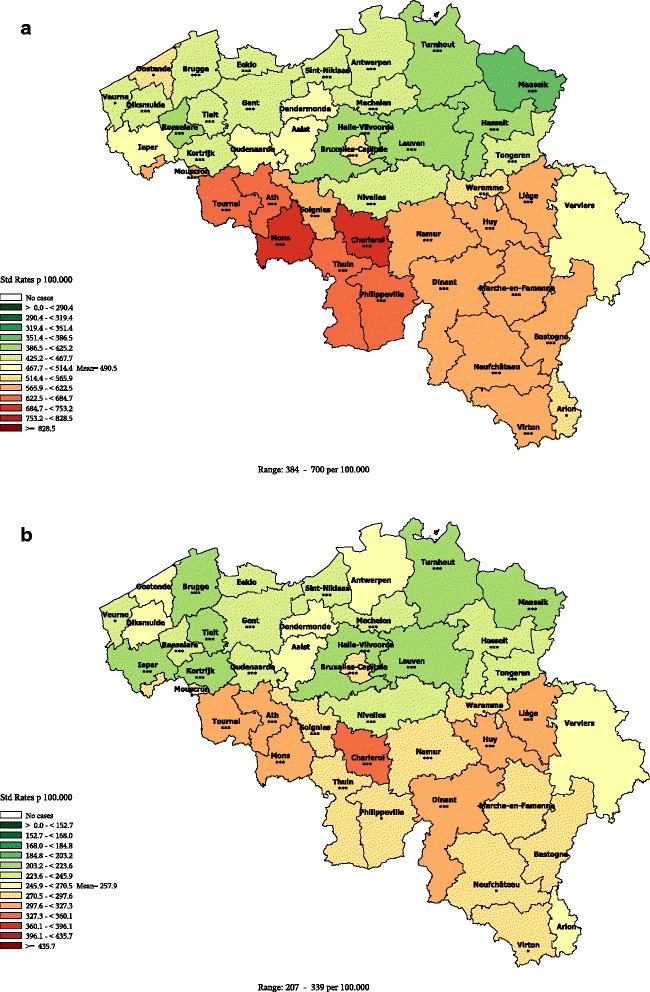
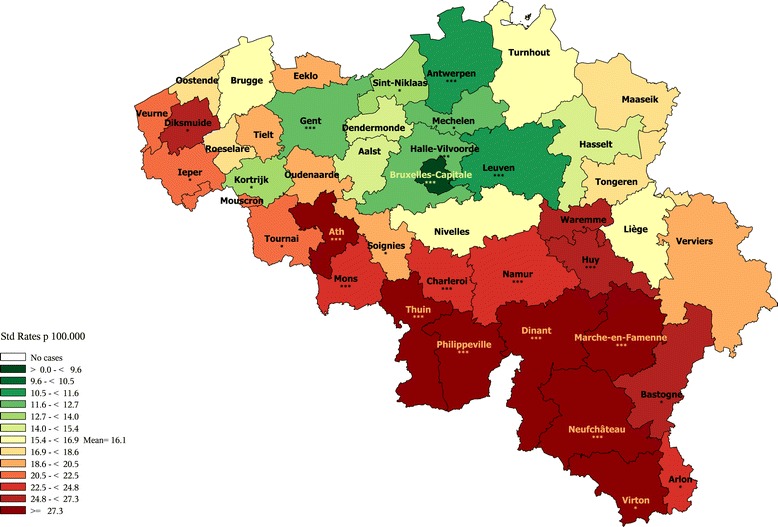
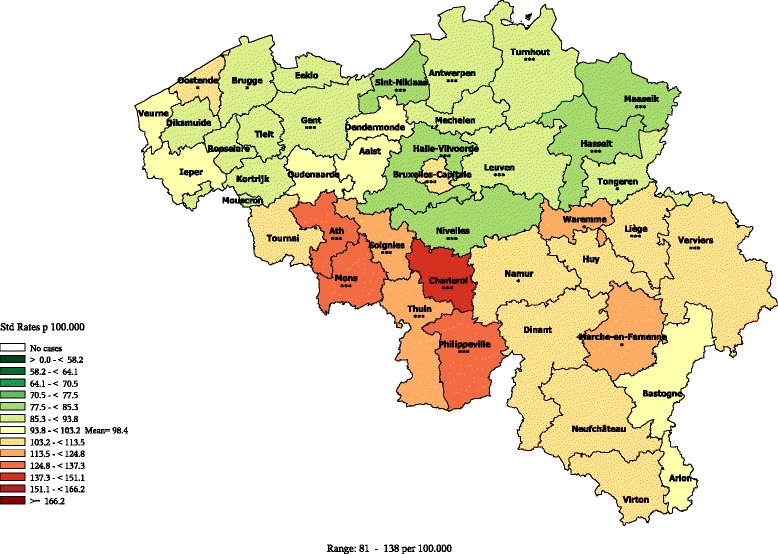
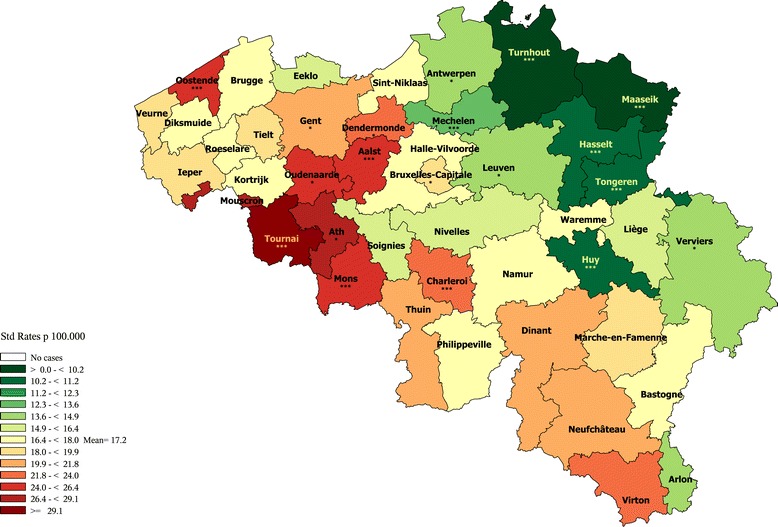
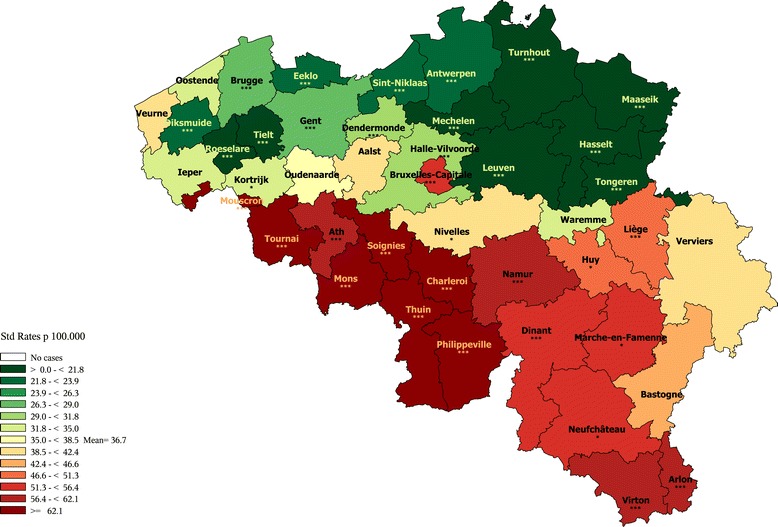
Causes of deaths and population data were provided by Statistics Belgium. All deaths occurring in the periods 1993-1999 and 2003-2009, in people aged 1-74 residing in Belgium were included. Age-adjusted rates by cause of death were computed for both periods; the 2003-2009 rates were classified using a relative scale with a 10% change between each level and represented on chloropleths maps with a green-to-red divergent colour scheme centred on the national mean. This particular design allows the comparability across all the maps since a same meaning is given to a specific colour. The variation coefficient and the decile ratio were calculated and compared between the 2 periods.

RESULTS

A clear-cut regional divide at the disadvantage of Wallonia, and to some extent, of Brussels, was seen for all-cause, cardiovascular, cerebrovascular, diabetes, alcohol-related, mental and neurological diseases and non-transport accidents premature mortality. A NE-SW pattern parallel to the French border was observed for Lip, Oral Cavity, Pharynx, Larynx and oesophageal cancers, while various patterns are observed for the other cancers. The highest rates of road accident mortality are observed in the Southern districts. Many of those patterns are in continuity with earlier observations. However, the pattern of diabetes and mental and neurological diseases are new features. The variation coefficient and the decile ratios increased by 10% between the 1993-1997 and 2003-2009 periods.

CONCLUSIONS

The use of a relative scale in the maps highlights the importance of the between-districts disparity in premature mortality, with for most causes, a clear-cut regional divide at the disadvantage of Wallonia; this health gap results of complex interactions between various factors, including the socioeconomic context, cultural habits and environmental influences, as well as public health policies. It should be considered as a warning signal, warranting the attention of the policy makers. Meanwhile, these results also highlight the potential for improvement in the more disadvantaged regions.

摘要

背景

降低过早死亡率是一项至关重要的公共卫生目标。本文的目的,除了用最新数据更新之前的死亡率地图集外,还在于使用相对比例地图设计来探索地区间的相对差异。

方法

死亡原因和人口数据由比利时统计局提供。纳入了1993 - 1999年和2003 - 2009年期间居住在比利时的1 - 74岁人群中的所有死亡病例。计算了两个时期按死亡原因调整的死亡率;2003 - 2009年的死亡率使用相对比例进行分类,每个级别之间有10%的变化,并在分级统计图上用以全国平均值为中心的绿到红的发散配色方案表示。这种特殊设计使得所有地图具有可比性,因为特定颜色具有相同含义。计算并比较了两个时期的变异系数和十分位数比率。

结果

在全因、心血管、脑血管、糖尿病、酒精相关、精神和神经疾病以及非交通事故过早死亡率方面,明显存在以瓦隆地区为劣势,在一定程度上布鲁塞尔也处于劣势的区域划分。唇、口腔、咽、喉和食管癌呈现出与法国边境平行的东北 - 西南模式,而其他癌症则呈现出各种不同模式。交通事故死亡率最高的地区在南部。其中许多模式与早期观察结果一致。然而,糖尿病以及精神和神经疾病的模式是新特征。1993 - 1997年和2003 - 2009年期间,变异系数和十分位数比率增加了10%。

结论

地图中使用相对比例突出了地区间过早死亡率差异的重要性,对于大多数死因而言,明显存在以瓦隆地区为劣势的区域划分;这种健康差距是多种因素复杂相互作用的结果,包括社会经济背景、文化习惯和环境影响以及公共卫生政策。应将其视为一个警示信号,值得政策制定者关注。同时,这些结果也凸显了较弱势地区的改善潜力。

https://cdn.ncbi.nlm.nih.gov/pmc/blobs/6b0e/4412101/9182412213c4/13690_2015_60_Fig7_HTML.jpg
https://cdn.ncbi.nlm.nih.gov/pmc/blobs/6b0e/4412101/3d7a3e943ded/13690_2015_60_Fig1_HTML.jpg
https://cdn.ncbi.nlm.nih.gov/pmc/blobs/6b0e/4412101/0c1f0bc730d3/13690_2015_60_Fig2_HTML.jpg
https://cdn.ncbi.nlm.nih.gov/pmc/blobs/6b0e/4412101/c12e7968ec52/13690_2015_60_Fig3_HTML.jpg
https://cdn.ncbi.nlm.nih.gov/pmc/blobs/6b0e/4412101/62b1cdee098d/13690_2015_60_Fig4_HTML.jpg
https://cdn.ncbi.nlm.nih.gov/pmc/blobs/6b0e/4412101/05e0cfd4622f/13690_2015_60_Fig5_HTML.jpg
https://cdn.ncbi.nlm.nih.gov/pmc/blobs/6b0e/4412101/83def2ca8c39/13690_2015_60_Fig6_HTML.jpg
https://cdn.ncbi.nlm.nih.gov/pmc/blobs/6b0e/4412101/9182412213c4/13690_2015_60_Fig7_HTML.jpg

相似文献

1
Mapping the cause-specific premature mortality reveals large between-districts disparity in Belgium, 2003-2009.绘制特定病因的过早死亡率显示,2003年至2009年期间比利时各地区之间存在巨大差异。
Arch Public Health. 2015 Mar 23;73(1):13. doi: 10.1186/s13690-015-0060-5. eCollection 2015.
2
Premature mortality in Belgium in 1993-2009: leading causes, regional disparities and 15 years change.1993-2009 年比利时的过早死亡率:主要原因、地区差异和 15 年变化。
Arch Public Health. 2014 Oct 1;72(1):34. doi: 10.1186/2049-3258-72-34. eCollection 2014.
3
Educational inequalities in premature mortality by region in the Belgian population in the 2000s.21世纪比利时人口中按地区划分的过早死亡率方面的教育不平等现象。
Arch Public Health. 2017 Oct 16;75:44. doi: 10.1186/s13690-017-0212-x. eCollection 2017.
4
[Mortality Atlas of the Campania Region. All-cause and cause-specific mortality at municipal level, 2006-2014].[坎帕尼亚大区死亡率地图集。2006 - 2014年市级全因死亡率和特定病因死亡率]
Epidemiol Prev. 2020 Jan-Feb;44(1 Suppl 1):1-144. doi: 10.19191/EP20.1.S1.P001.003.
5
[State of health of populations residing in geothermal areas of Tuscany].[托斯卡纳地热区居民的健康状况]
Epidemiol Prev. 2012 Sep-Oct;36(5 Suppl 1):1-104.
6
Folic acid supplementation and malaria susceptibility and severity among people taking antifolate antimalarial drugs in endemic areas.在流行地区,服用抗叶酸抗疟药物的人群中,叶酸补充剂与疟疾易感性和严重程度的关系。
Cochrane Database Syst Rev. 2022 Feb 1;2(2022):CD014217. doi: 10.1002/14651858.CD014217.
7
[SENTIERI - Epidemiological Study of Residents in National Priority Contaminated Sites. Sixth Report].[国家重点污染场地居民流行病学研究。第六次报告]
Epidemiol Prev. 2023 Jan-Apr;47(1-2 Suppl 1):1-286. doi: 10.19191/EP23.1-2-S1.003.
8
Global and regional mortality from 235 causes of death for 20 age groups in 1990 and 2010: a systematic analysis for the Global Burden of Disease Study 2010.1990年和2010年20个年龄组中235种死因的全球和区域死亡率:全球疾病负担研究2010的系统分析
Lancet. 2012 Dec 15;380(9859):2095-128. doi: 10.1016/S0140-6736(12)61728-0.
9
Premature avoidable deaths by road traffic injuries in Belgium: trends and geographical disparities.比利时道路交通伤害导致的过早可避免死亡:趋势与地理差异
Eur J Epidemiol. 2001;17(9):841-5. doi: 10.1023/a:1015605724990.
10
Mortality-Air Pollution Associations in Low Exposure Environments (MAPLE): Phase 2.低暴露环境下死亡率与空气污染关联研究(MAPLE):第二阶段。
Res Rep Health Eff Inst. 2022 Jul;2022(212):1-91.

引用本文的文献

1
Estimating years of life lost due to premature mortality at regional level in France in 2017, using a probabilistic redistribution approach.采用概率再分配方法估算2017年法国地区层面因过早死亡导致的寿命损失年数。
BMC Public Health. 2025 Jul 3;25(1):2375. doi: 10.1186/s12889-025-23559-6.
2
Trends in socioeconomic inequalities in cause-specific premature mortality in Belgium, 1998-2019.比利时特定病因的社会经济不平等导致的过早死亡率趋势,1998-2019 年。
BMC Public Health. 2024 Feb 14;24(1):470. doi: 10.1186/s12889-024-17933-z.
3
Heterogeneity in subnational mortality in the context of the COVID-19 pandemic: the case of Belgian districts in 2020.

本文引用的文献

1
Regional variation in incidence for smoking and alcohol related cancers in Belgium.比利时吸烟和酒精相关癌症发病率的地区差异。
Cancer Epidemiol. 2015 Feb;39(1):55-65. doi: 10.1016/j.canep.2014.10.009. Epub 2014 Oct 31.
2
CDC National Health Report: leading causes of morbidity and mortality and associated behavioral risk and protective factors--United States, 2005-2013.美国疾病控制与预防中心国家健康报告:2005 - 2013年美国发病和死亡的主要原因以及相关行为风险和保护因素
MMWR Suppl. 2014 Oct 31;63(4):3-27.
3
Premature mortality in Belgium in 1993-2009: leading causes, regional disparities and 15 years change.
新冠疫情背景下国家以下层面死亡率的异质性:以2020年比利时各地区为例
Arch Public Health. 2022 May 6;80(1):130. doi: 10.1186/s13690-022-00874-7.
4
Educational inequalities in premature mortality by region in the Belgian population in the 2000s.21世纪比利时人口中按地区划分的过早死亡率方面的教育不平等现象。
Arch Public Health. 2017 Oct 16;75:44. doi: 10.1186/s13690-017-0212-x. eCollection 2017.
5
General practice patients treated for substance use problems: a cross-national observational study in Belgium.接受物质使用问题治疗的全科医疗患者:比利时的一项跨国观察性研究。
BMC Public Health. 2016 Dec 8;16(1):1235. doi: 10.1186/s12889-016-3885-0.
6
The geographic pattern of Belgian mortality: can socio-economic characteristics explain area differences?比利时死亡率的地理分布模式:社会经济特征能否解释地区差异?
Arch Public Health. 2016 Jun 8;74:22. doi: 10.1186/s13690-016-0135-y. eCollection 2016.
1993-2009 年比利时的过早死亡率:主要原因、地区差异和 15 年变化。
Arch Public Health. 2014 Oct 1;72(1):34. doi: 10.1186/2049-3258-72-34. eCollection 2014.
4
Individual-level concentrations of fine particulate matter chemical components and subclinical atherosclerosis: a cross-sectional analysis based on 2 advanced exposure prediction models in the multi-ethnic study of atherosclerosis.个体层面细颗粒物化学成分浓度与亚临床动脉粥样硬化:基于动脉粥样硬化多族裔研究中2种先进暴露预测模型的横断面分析
Am J Epidemiol. 2014 Oct 1;180(7):718-28. doi: 10.1093/aje/kwu186. Epub 2014 Aug 26.
5
Descriptive epidemiology of chronic liver disease in northeastern Italy: an analysis of multiple causes of death.意大利东北部慢性肝病的描述性流行病学:多种死因分析。
Popul Health Metr. 2013 Oct 10;11(1):20. doi: 10.1186/1478-7954-11-20.
6
Methodological basics and evolution of the Belgian health interview survey 1997-2008.1997-2008 年比利时健康访谈调查的方法学基础和演变。
Arch Public Health. 2013 Sep 18;71(1):24. doi: 10.1186/0778-7367-71-24.
7
[Particle pollution effects on the risk of cardiovascular diseases].
Ann Cardiol Angeiol (Paris). 2014 Feb;63(1):40-7. doi: 10.1016/j.ancard.2013.08.017. Epub 2013 Aug 27.
8
Cancer incidence and mortality patterns in Europe: estimates for 40 countries in 2012.欧洲癌症发病率和死亡率模式:2012 年 40 个国家的估计数。
Eur J Cancer. 2013 Apr;49(6):1374-403. doi: 10.1016/j.ejca.2012.12.027. Epub 2013 Feb 26.
9
Reporting of perinatal health indicators for international comparisons--enhancing the appearance of geographical plots.国际比较的围产健康指标报告--增强地理图的外观。
Eur J Public Health. 2013 Dec;23(6):957-63. doi: 10.1093/eurpub/cks176. Epub 2013 Jan 7.
10
High burden of breast cancer in Belgium: recent trends in incidence (1999-2006) and historical trends in mortality (1954-2006).比利时乳腺癌负担沉重:发病率的近期趋势(1999-2006 年)和死亡率的历史趋势(1954-2006 年)。
Arch Public Health. 2011 Oct 24;69(1):2. doi: 10.1186/0778-7367-69-2.