van der Waal Daniëlle, den Heeten Gerard J, Pijnappel Ruud M, Schuur Klaas H, Timmers Johanna M H, Verbeek André L M, Broeders Mireille J M
Radboud university medical center, Radboud Institute for Health Sciences, Nijmegen, The Netherlands.
Dutch Reference Centre for Screening, Nijmegen, The Netherlands; Department of Radiology, Academic Medical Centre, University of Amsterdam, Amsterdam, The Netherlands.
PLoS One. 2015 Sep 3;10(9):e0136667. doi: 10.1371/journal.pone.0136667. eCollection 2015.
The objective of this study is to compare different methods for measuring breast density, both visual assessments and automated volumetric density, in a breast cancer screening setting. These measures could potentially be implemented in future screening programmes, in the context of personalised screening or screening evaluation.
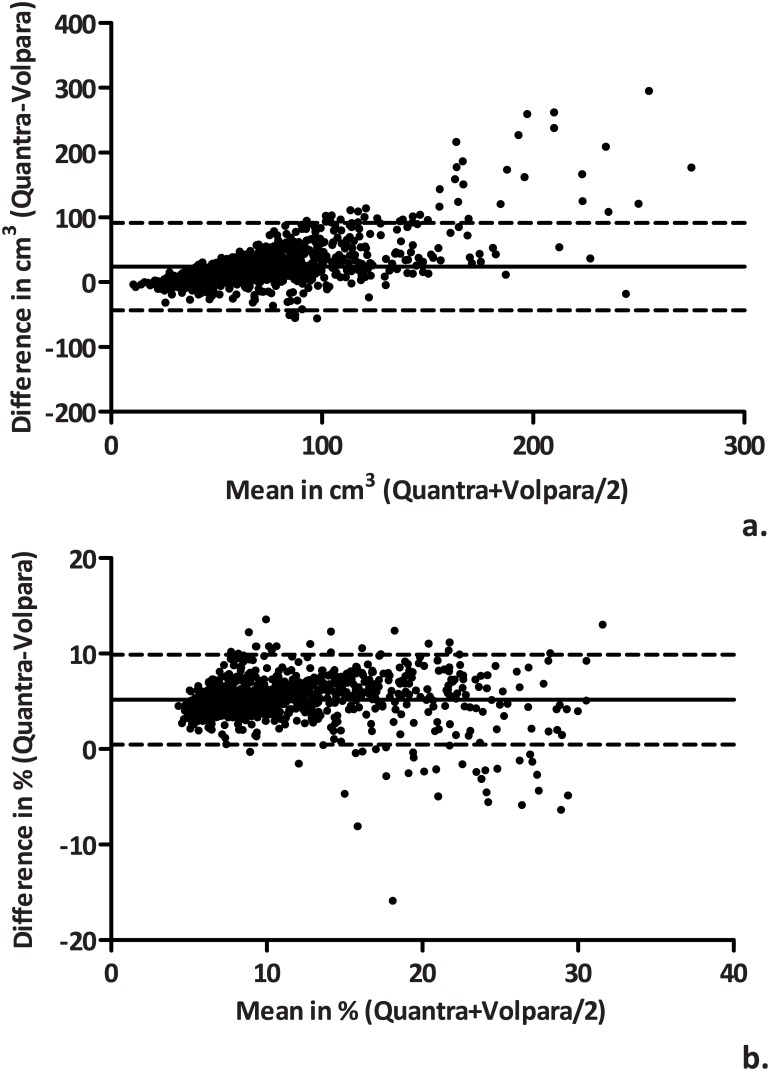
Digital mammographic exams (N = 992) of women participating in the Dutch breast cancer screening programme (age 50-75y) in 2013 were included. Breast density was measured in three different ways: BI-RADS density (5th edition) and with two commercially available automated software programs (Quantra and Volpara volumetric density). BI-RADS density (ordinal scale) was assessed by three radiologists. Quantra (v1.3) and Volpara (v1.5.0) provide continuous estimates. Different comparison methods were used, including Bland-Altman plots and correlation coefficients (e.g., intraclass correlation coefficient [ICC]).
Based on the BI-RADS classification, 40.8% of the women had 'heterogeneously or extremely dense' breasts. The median volumetric percent density was 12.1% (IQR: 9.6-16.5) for Quantra, which was higher than the Volpara estimate (median 6.6%, IQR: 4.4-10.9). The mean difference between Quantra and Volpara was 5.19% (95% CI: 5.04-5.34) (ICC: 0.64). There was a clear increase in volumetric percent dense volume as BI-RADS density increased. The highest accuracy for predicting the presence of BI-RADS c+d (heterogeneously or extremely dense) was observed with a cut-off value of 8.0% for Volpara and 13.8% for Quantra.
Although there was no perfect agreement, there appeared to be a strong association between all three measures. Both volumetric density measures seem to be usable in breast cancer screening programmes, provided that the required data flow can be realized.
本研究的目的是在乳腺癌筛查环境中比较测量乳腺密度的不同方法,包括视觉评估和自动体积密度测量。在个性化筛查或筛查评估的背景下,这些测量方法有可能在未来的筛查项目中实施。
纳入了2013年参加荷兰乳腺癌筛查项目(年龄50 - 75岁)的女性的数字化乳腺钼靶检查(N = 992)。乳腺密度通过三种不同方式测量:BI-RADS密度(第5版)以及两种商用自动软件程序(Quantra和Volpara体积密度)。BI-RADS密度(有序量表)由三位放射科医生评估。Quantra(v1.3)和Volpara(v1.5.0)提供连续估计值。使用了不同的比较方法,包括布兰德-奥特曼图和相关系数(如组内相关系数[ICC])。
基于BI-RADS分类,40.8%的女性乳房为“不均匀或极度致密”。Quantra的体积密度中位数百分比为12.1%(四分位间距:9.6 - 16.5),高于Volpara的估计值(中位数6.6%,四分位间距:4.4 - 10.9)。Quantra和Volpara之间的平均差异为5.19%(95%置信区间:5.04 - 5.34)(ICC:0.64)。随着BI-RADS密度增加,体积密度百分比明显增加。对于预测BI-RADS c + d(不均匀或极度致密)的存在,Volpara的临界值为8.0%,Quantra的临界值为13.8%时观察到最高准确性。
尽管没有完全一致的结果,但这三种测量方法之间似乎存在很强的关联。只要能够实现所需的数据流,两种体积密度测量方法似乎都可用于乳腺癌筛查项目。