Suppr超能文献

用于可视化心跳时间序列结构的多尺度庞加莱图。

Multiscale Poincaré plots for visualizing the structure of heartbeat time series.

作者信息

Henriques Teresa S, Mariani Sara, Burykin Anton, Rodrigues Filipa, Silva Tiago F, Goldberger Ary L

机构信息

Wyss Institute for Biologically Inspired Engineering at Harvard University, Boston, MA, USA.

Center for Anesthesia Research and Excellence (CARE), Beth Israel Deaconess Medical Center, Boston, MA, USA.

出版信息

BMC Med Inform Decis Mak. 2016 Feb 9;16:17. doi: 10.1186/s12911-016-0252-0.

Abstract

BACKGROUND

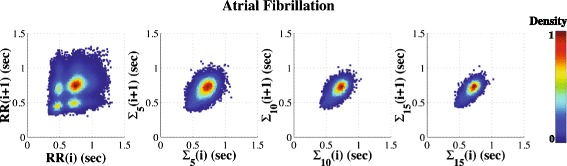
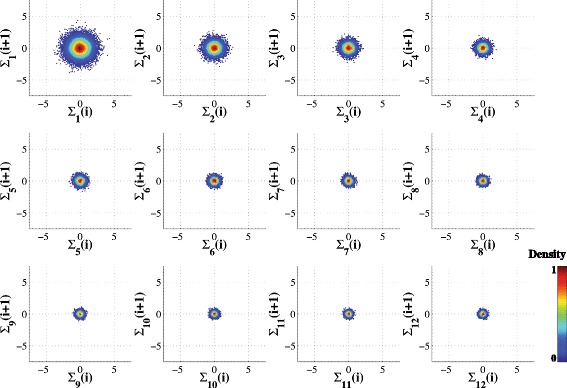
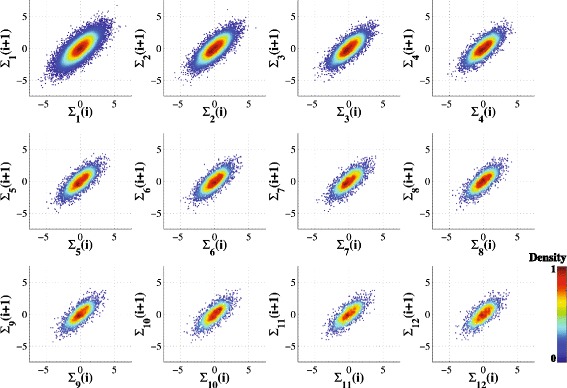
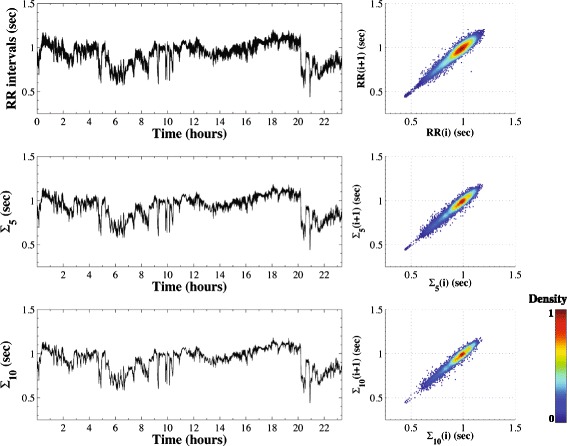
Poincaré delay maps are widely used in the analysis of cardiac interbeat interval (RR) dynamics. To facilitate visualization of the structure of these time series, we introduce multiscale Poincaré (MSP) plots.

METHODS

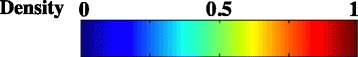
Starting with the original RR time series, the method employs a coarse-graining procedure to create a family of time series, each of which represents the system's dynamics in a different time scale. Next, the Poincaré plots are constructed for the original and the coarse-grained time series. Finally, as an optional adjunct, color can be added to each point to represent its normalized frequency.

RESULTS

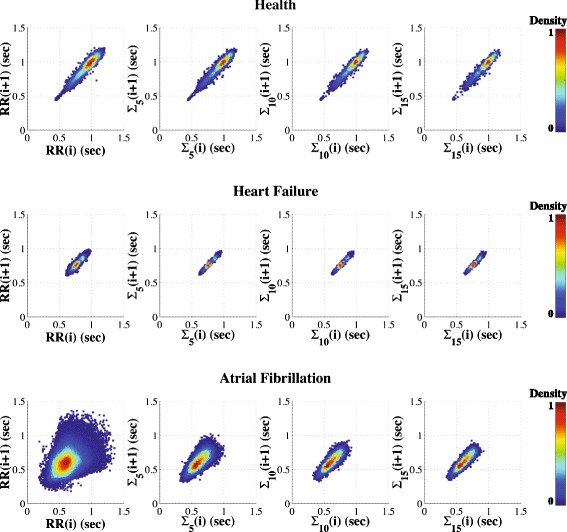
We illustrate the MSP method on simulated Gaussian white and 1/f noise time series. The MSP plots of 1/f noise time series reveal relative conservation of the phase space area over multiple time scales, while those of white noise show a marked reduction in area. We also show how MSP plots can be used to illustrate the loss of complexity when heartbeat time series from healthy subjects are compared with those from patients with chronic (congestive) heart failure syndrome or with atrial fibrillation.

CONCLUSIONS

This generalized multiscale approach to Poincaré plots may be useful in visualizing other types of time series.

摘要

背景

庞加莱延迟映射广泛应用于心脏搏动间期(RR)动力学分析。为便于可视化这些时间序列的结构,我们引入了多尺度庞加莱(MSP)图。

方法

该方法从原始RR时间序列开始,采用粗粒化程序创建一系列时间序列,每个序列代表系统在不同时间尺度下的动力学。接下来,为原始时间序列和粗粒化时间序列构建庞加莱图。最后,作为一种可选的辅助手段,可以为每个点添加颜色以表示其归一化频率。

结果

我们在模拟的高斯白噪声和1/f噪声时间序列上展示了MSP方法。1/f噪声时间序列的MSP图显示相空间面积在多个时间尺度上相对守恒,而白噪声的MSP图显示面积显著减小。我们还展示了如何使用MSP图来说明健康受试者的心跳时间序列与慢性(充血性)心力衰竭综合征患者或心房颤动患者的心跳时间序列相比复杂性的丧失。

结论

这种广义的庞加莱图多尺度方法可能有助于可视化其他类型的时间序列。

https://cdn.ncbi.nlm.nih.gov/pmc/blobs/d6e1/4746786/7acf0c96db36/12911_2016_252_Fig1_HTML.jpg

相似文献

1
Multiscale Poincaré plots for visualizing the structure of heartbeat time series.
BMC Med Inform Decis Mak. 2016 Feb 9;16:17. doi: 10.1186/s12911-016-0252-0.
2
Dynamical density delay maps: simple, new method for visualising the behaviour of complex systems.
BMC Med Inform Decis Mak. 2014 Jan 18;14:6. doi: 10.1186/1472-6947-14-6.
3
A multi-scale feedback ratio analysis of heartbeat interval series in healthy vs. cardiac patients.
Med Eng Phys. 2014 Dec;36(12):1693-8. doi: 10.1016/j.medengphy.2014.09.015. Epub 2014 Oct 16.
6
Heart rate asymmetry by Poincaré plots of RR intervals.
Biomed Tech (Berl). 2006 Oct;51(4):272-5. doi: 10.1515/BMT.2006.054.
7
Geometric patterns of time-delay plots from different cardiac rhythms and arrhythmias using short-term EKG signals.
Clin Physiol Funct Imaging. 2018 Sep;38(5):856-863. doi: 10.1111/cpf.12494. Epub 2017 Dec 27.
8
Exploring total cardiac variability in healthy and pathophysiological subjects using improved refined multiscale entropy.
Med Biol Eng Comput. 2017 Feb;55(2):191-205. doi: 10.1007/s11517-016-1476-y. Epub 2016 Apr 23.
9
Multiscale analysis of short term heart beat interval, arterial blood pressure, and instantaneous lung volume time series.
Artif Intell Med. 2007 Nov;41(3):237-50. doi: 10.1016/j.artmed.2007.07.012. Epub 2007 Oct 22.

引用本文的文献

1
Application of short-term analysis of skin temperature variability in prediction of survival in patients with cirrhosis.
Front Netw Physiol. 2024 Jan 5;3:1291491. doi: 10.3389/fnetp.2023.1291491. eCollection 2023.
2
Assessing consciousness in patients with disorders of consciousness using soft-clustering.
Brain Inform. 2023 Jul 14;10(1):16. doi: 10.1186/s40708-023-00197-5.
5
Beat-to-Beat Patterning of Sinus Rhythm Reveals Non-linear Rhythm in the Dog Compared to the Human.
Front Physiol. 2020 Jan 22;10:1548. doi: 10.3389/fphys.2019.01548. eCollection 2019.
6
Electrocardiography Abnormalities in Macaques after Infection with Encephalitic Alphaviruses.
Pathogens. 2019 Nov 16;8(4):240. doi: 10.3390/pathogens8040240.
7
A Strategy to Reduce Bias of Entropy Estimates in Resting-State fMRI Signals.
Front Neurosci. 2018 Jun 13;12:398. doi: 10.3389/fnins.2018.00398. eCollection 2018.
8
New approach for visualization of relationships between RR and JT intervals.
PLoS One. 2017 Apr 5;12(4):e0174279. doi: 10.1371/journal.pone.0174279. eCollection 2017.
9
Exploring and visualizing multidimensional data in translational research platforms.
Brief Bioinform. 2017 Nov 1;18(6):1044-1056. doi: 10.1093/bib/bbw080.

本文引用的文献

1
Multiscale entropy analysis of human gait dynamics.
Physica A. 2003 Dec 1;330(1-2):53-60. doi: 10.1016/j.physa.2003.08.022. Epub 2003 Sep 21.
2
Remembrance of time series past: simple chromatic method for visualizing trends in biomedical signals.
Physiol Meas. 2015 Jul;36(7):N95-102. doi: 10.1088/0967-3334/36/7/N95. Epub 2015 May 27.
3
Dynamics of AV coupling during human atrial fibrillation: role of atrial rate.
Am J Physiol Heart Circ Physiol. 2015 Jul 1;309(1):H198-205. doi: 10.1152/ajpheart.00726.2014. Epub 2015 Apr 24.
4
Biophysical characterization of the underappreciated and important relationship between heart rate variability and heart rate.
Hypertension. 2014 Dec;64(6):1334-43. doi: 10.1161/HYPERTENSIONAHA.114.03782. Epub 2014 Sep 15.
5
"Glucose-at-a-Glance": New Method to Visualize the Dynamics of Continuous Glucose Monitoring Data.
J Diabetes Sci Technol. 2014 Mar;8(2):299-306. doi: 10.1177/1932296814524095. Epub 2014 Mar 2.
6
Dynamical density delay maps: simple, new method for visualising the behaviour of complex systems.
BMC Med Inform Decis Mak. 2014 Jan 18;14:6. doi: 10.1186/1472-6947-14-6.
7
Points of view: Mapping quantitative data to color.
Nat Methods. 2012 Aug;9(8):769. doi: 10.1038/nmeth.2134.
8
Nonparametric entropy estimation using kernel densities.
Methods Enzymol. 2009;467:531-546. doi: 10.1016/S0076-6879(09)67020-8.
10
Methods derived from nonlinear dynamics for analysing heart rate variability.
Philos Trans A Math Phys Eng Sci. 2009 Jan 28;367(1887):277-96. doi: 10.1098/rsta.2008.0232.

文献AI研究员

20分钟写一篇综述,助力文献阅读效率提升50倍。

立即体验

用中文搜PubMed

大模型驱动的PubMed中文搜索引擎

马上搜索

文档翻译

学术文献翻译模型,支持多种主流文档格式。

立即体验